01
INTRODUCTION
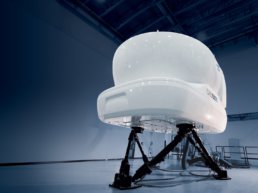
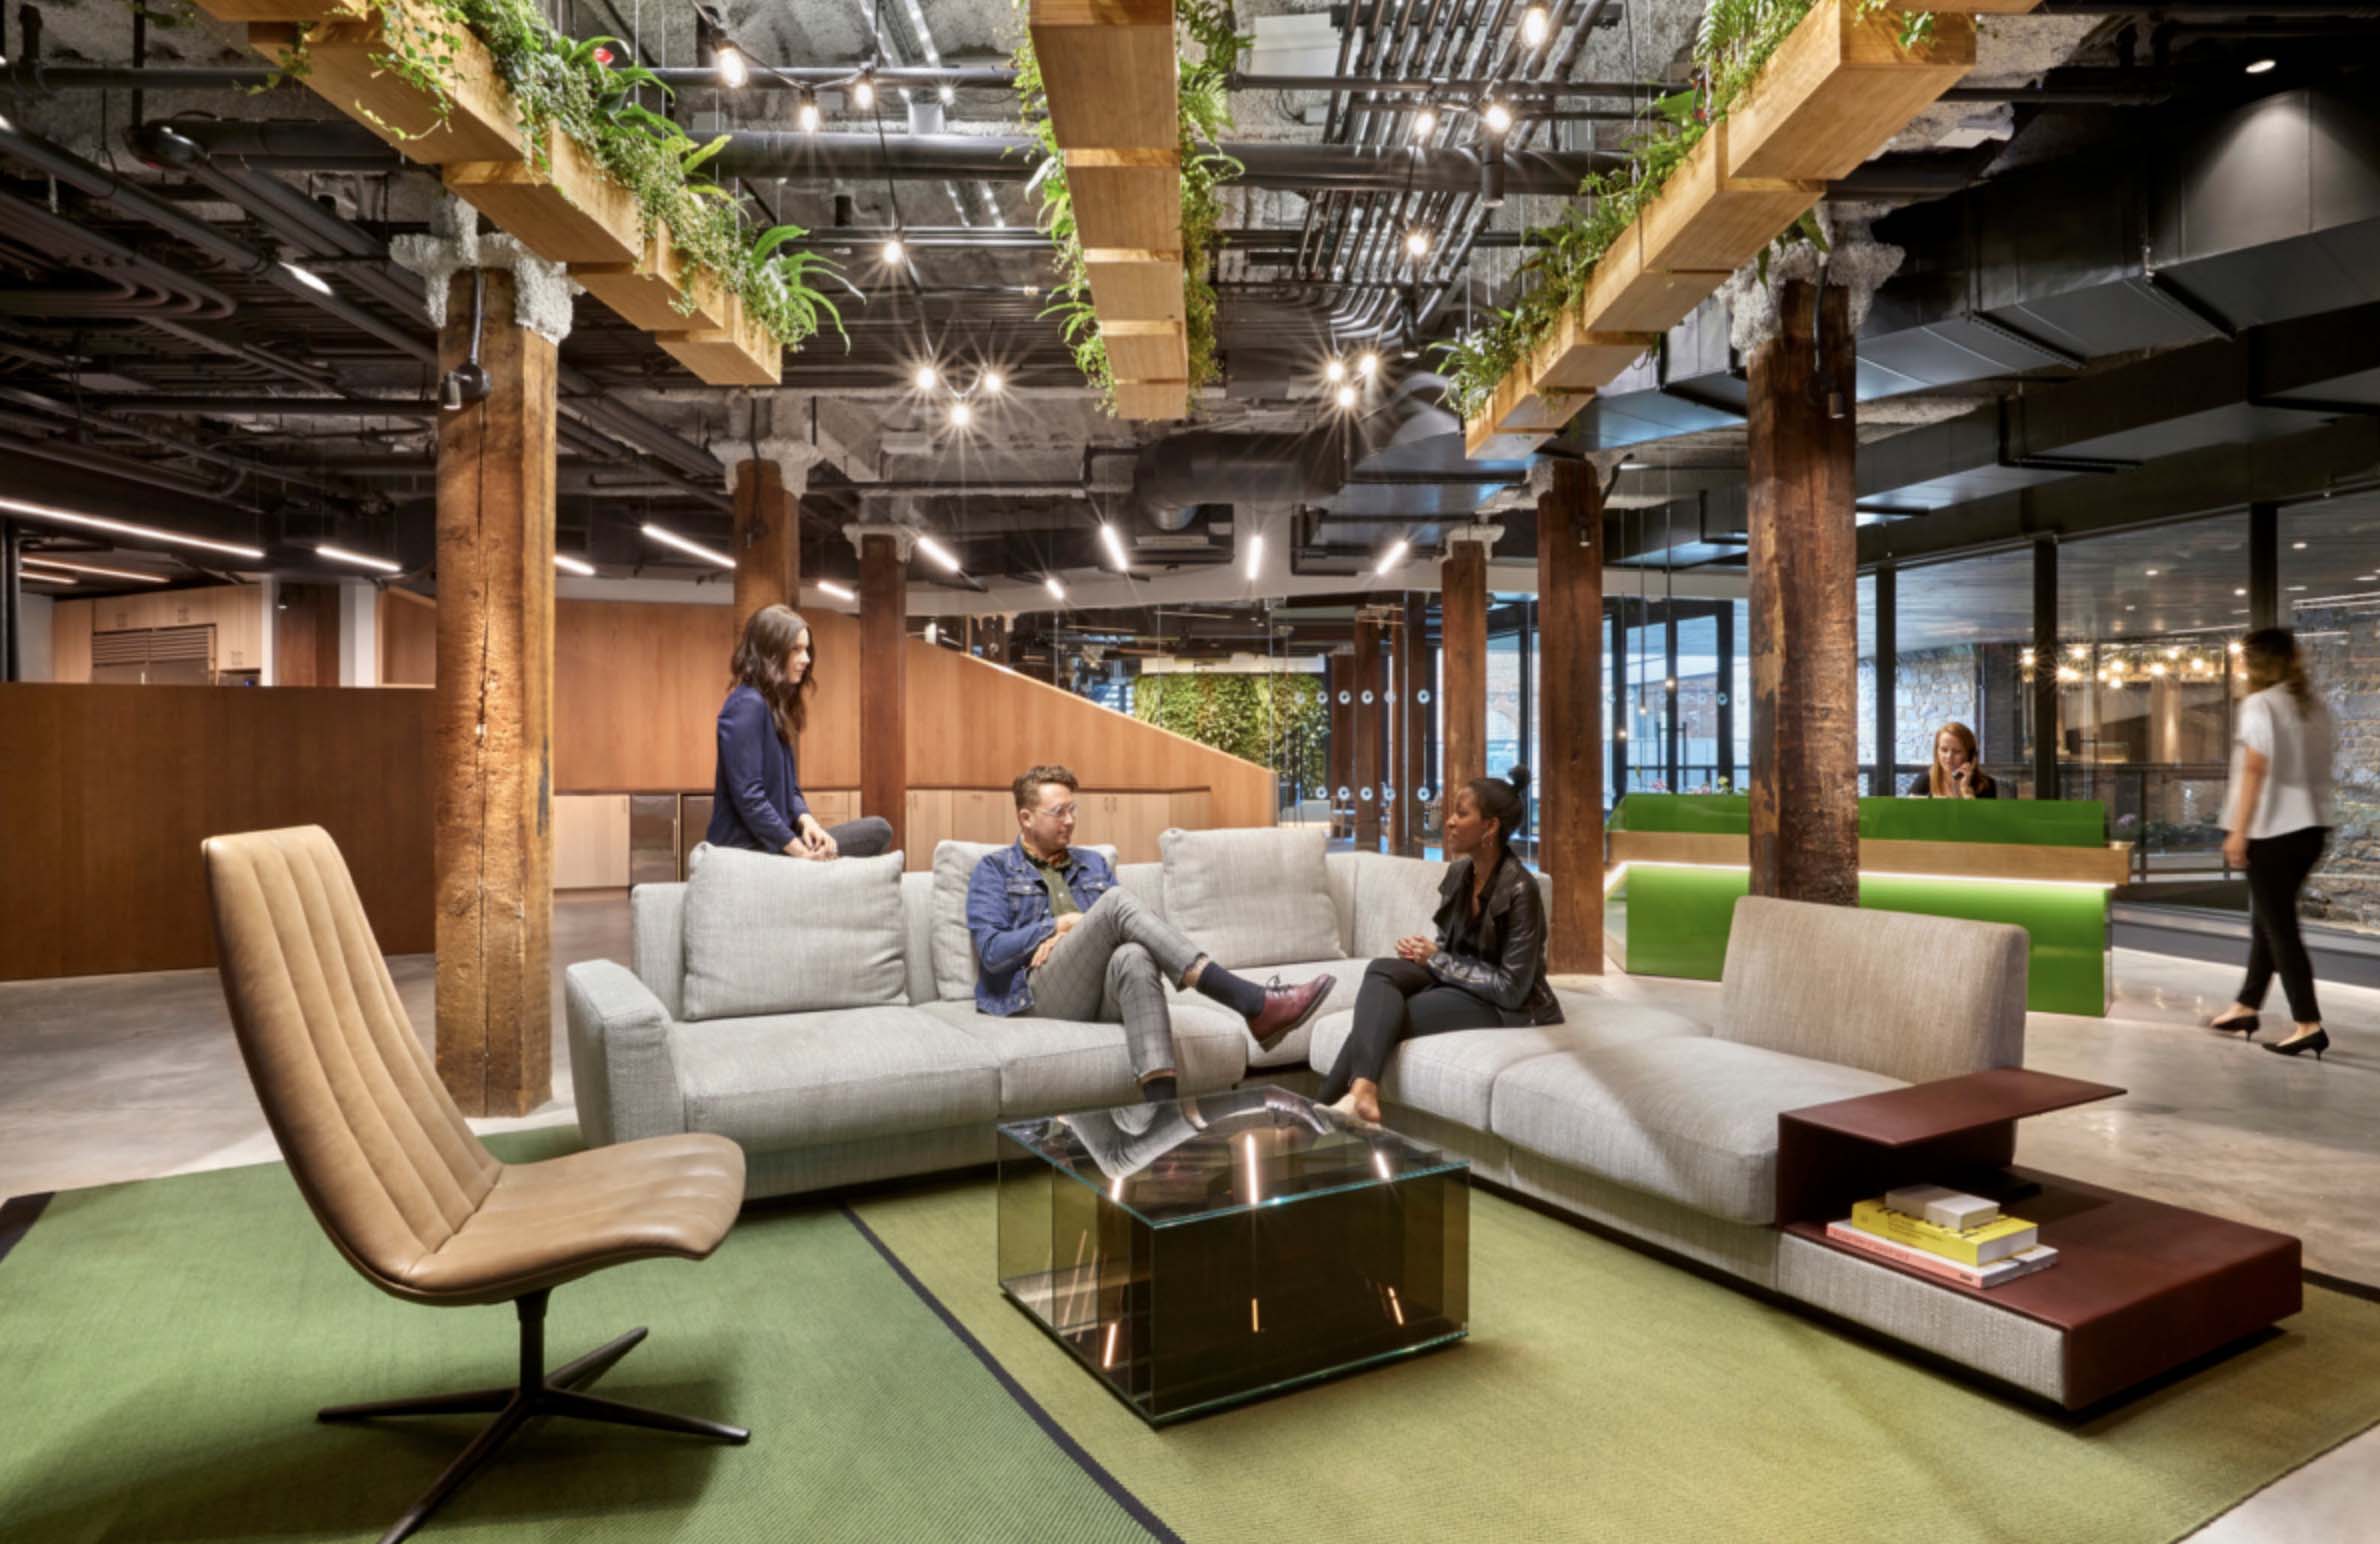
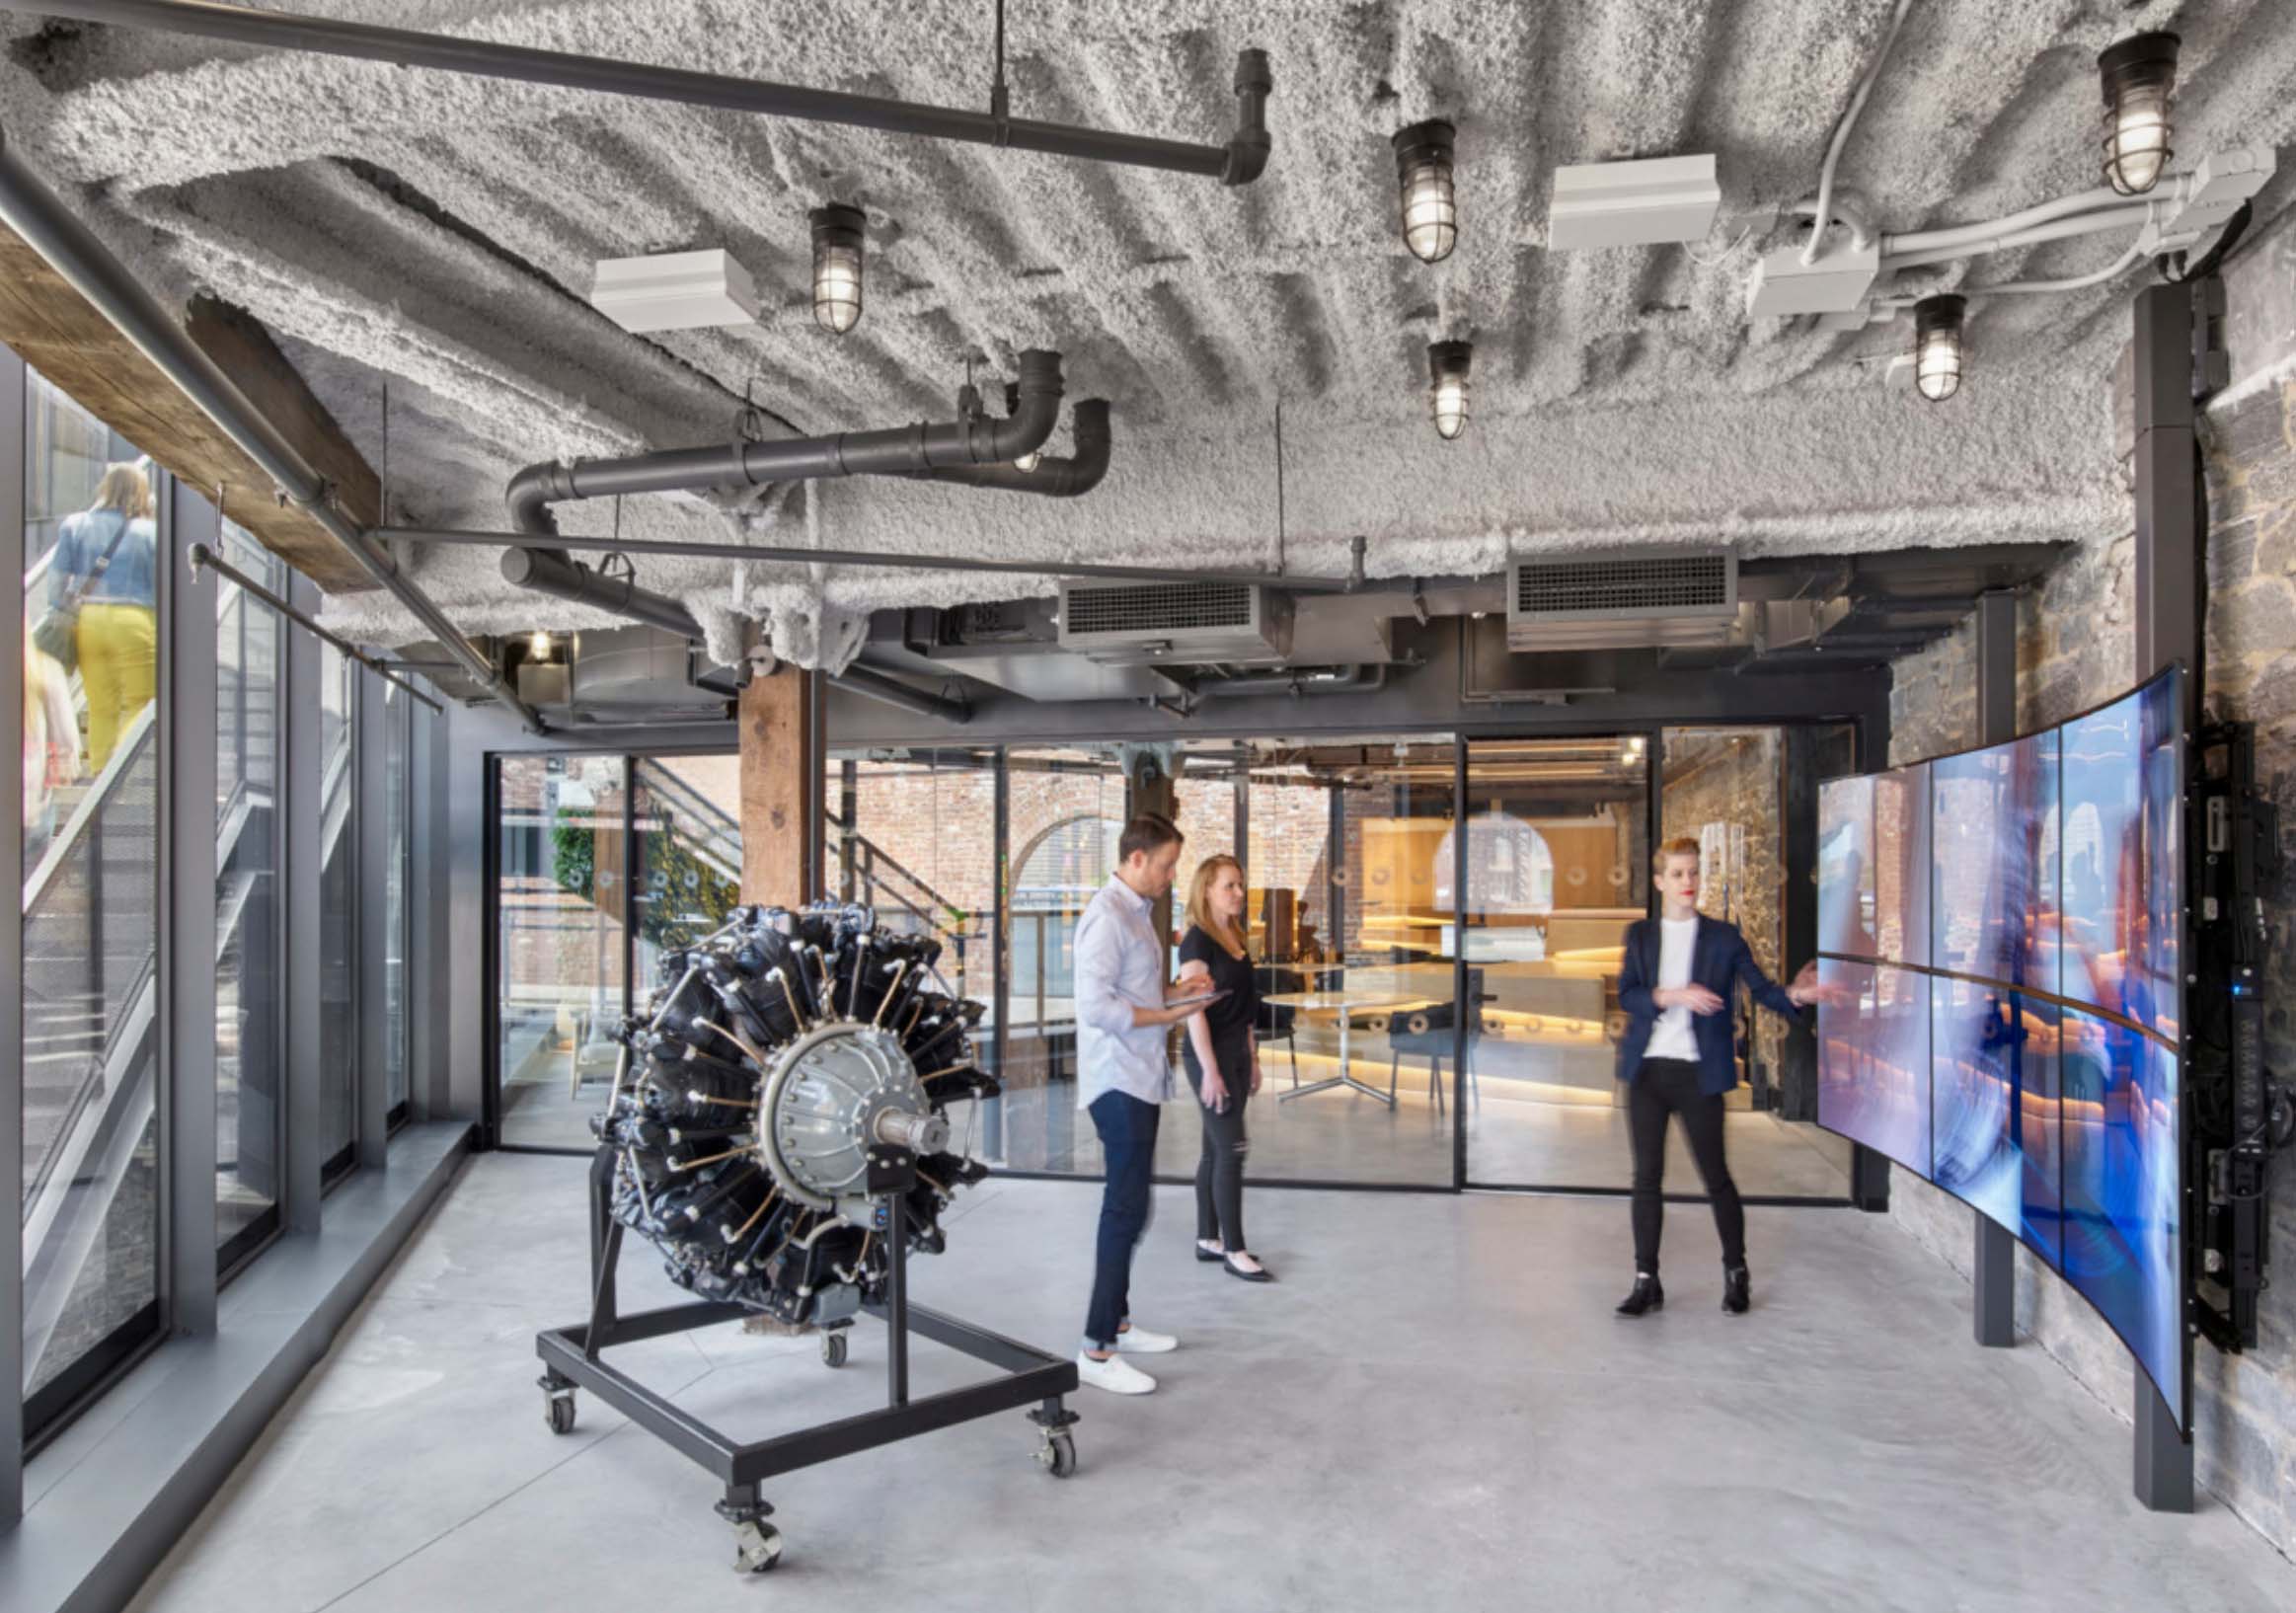
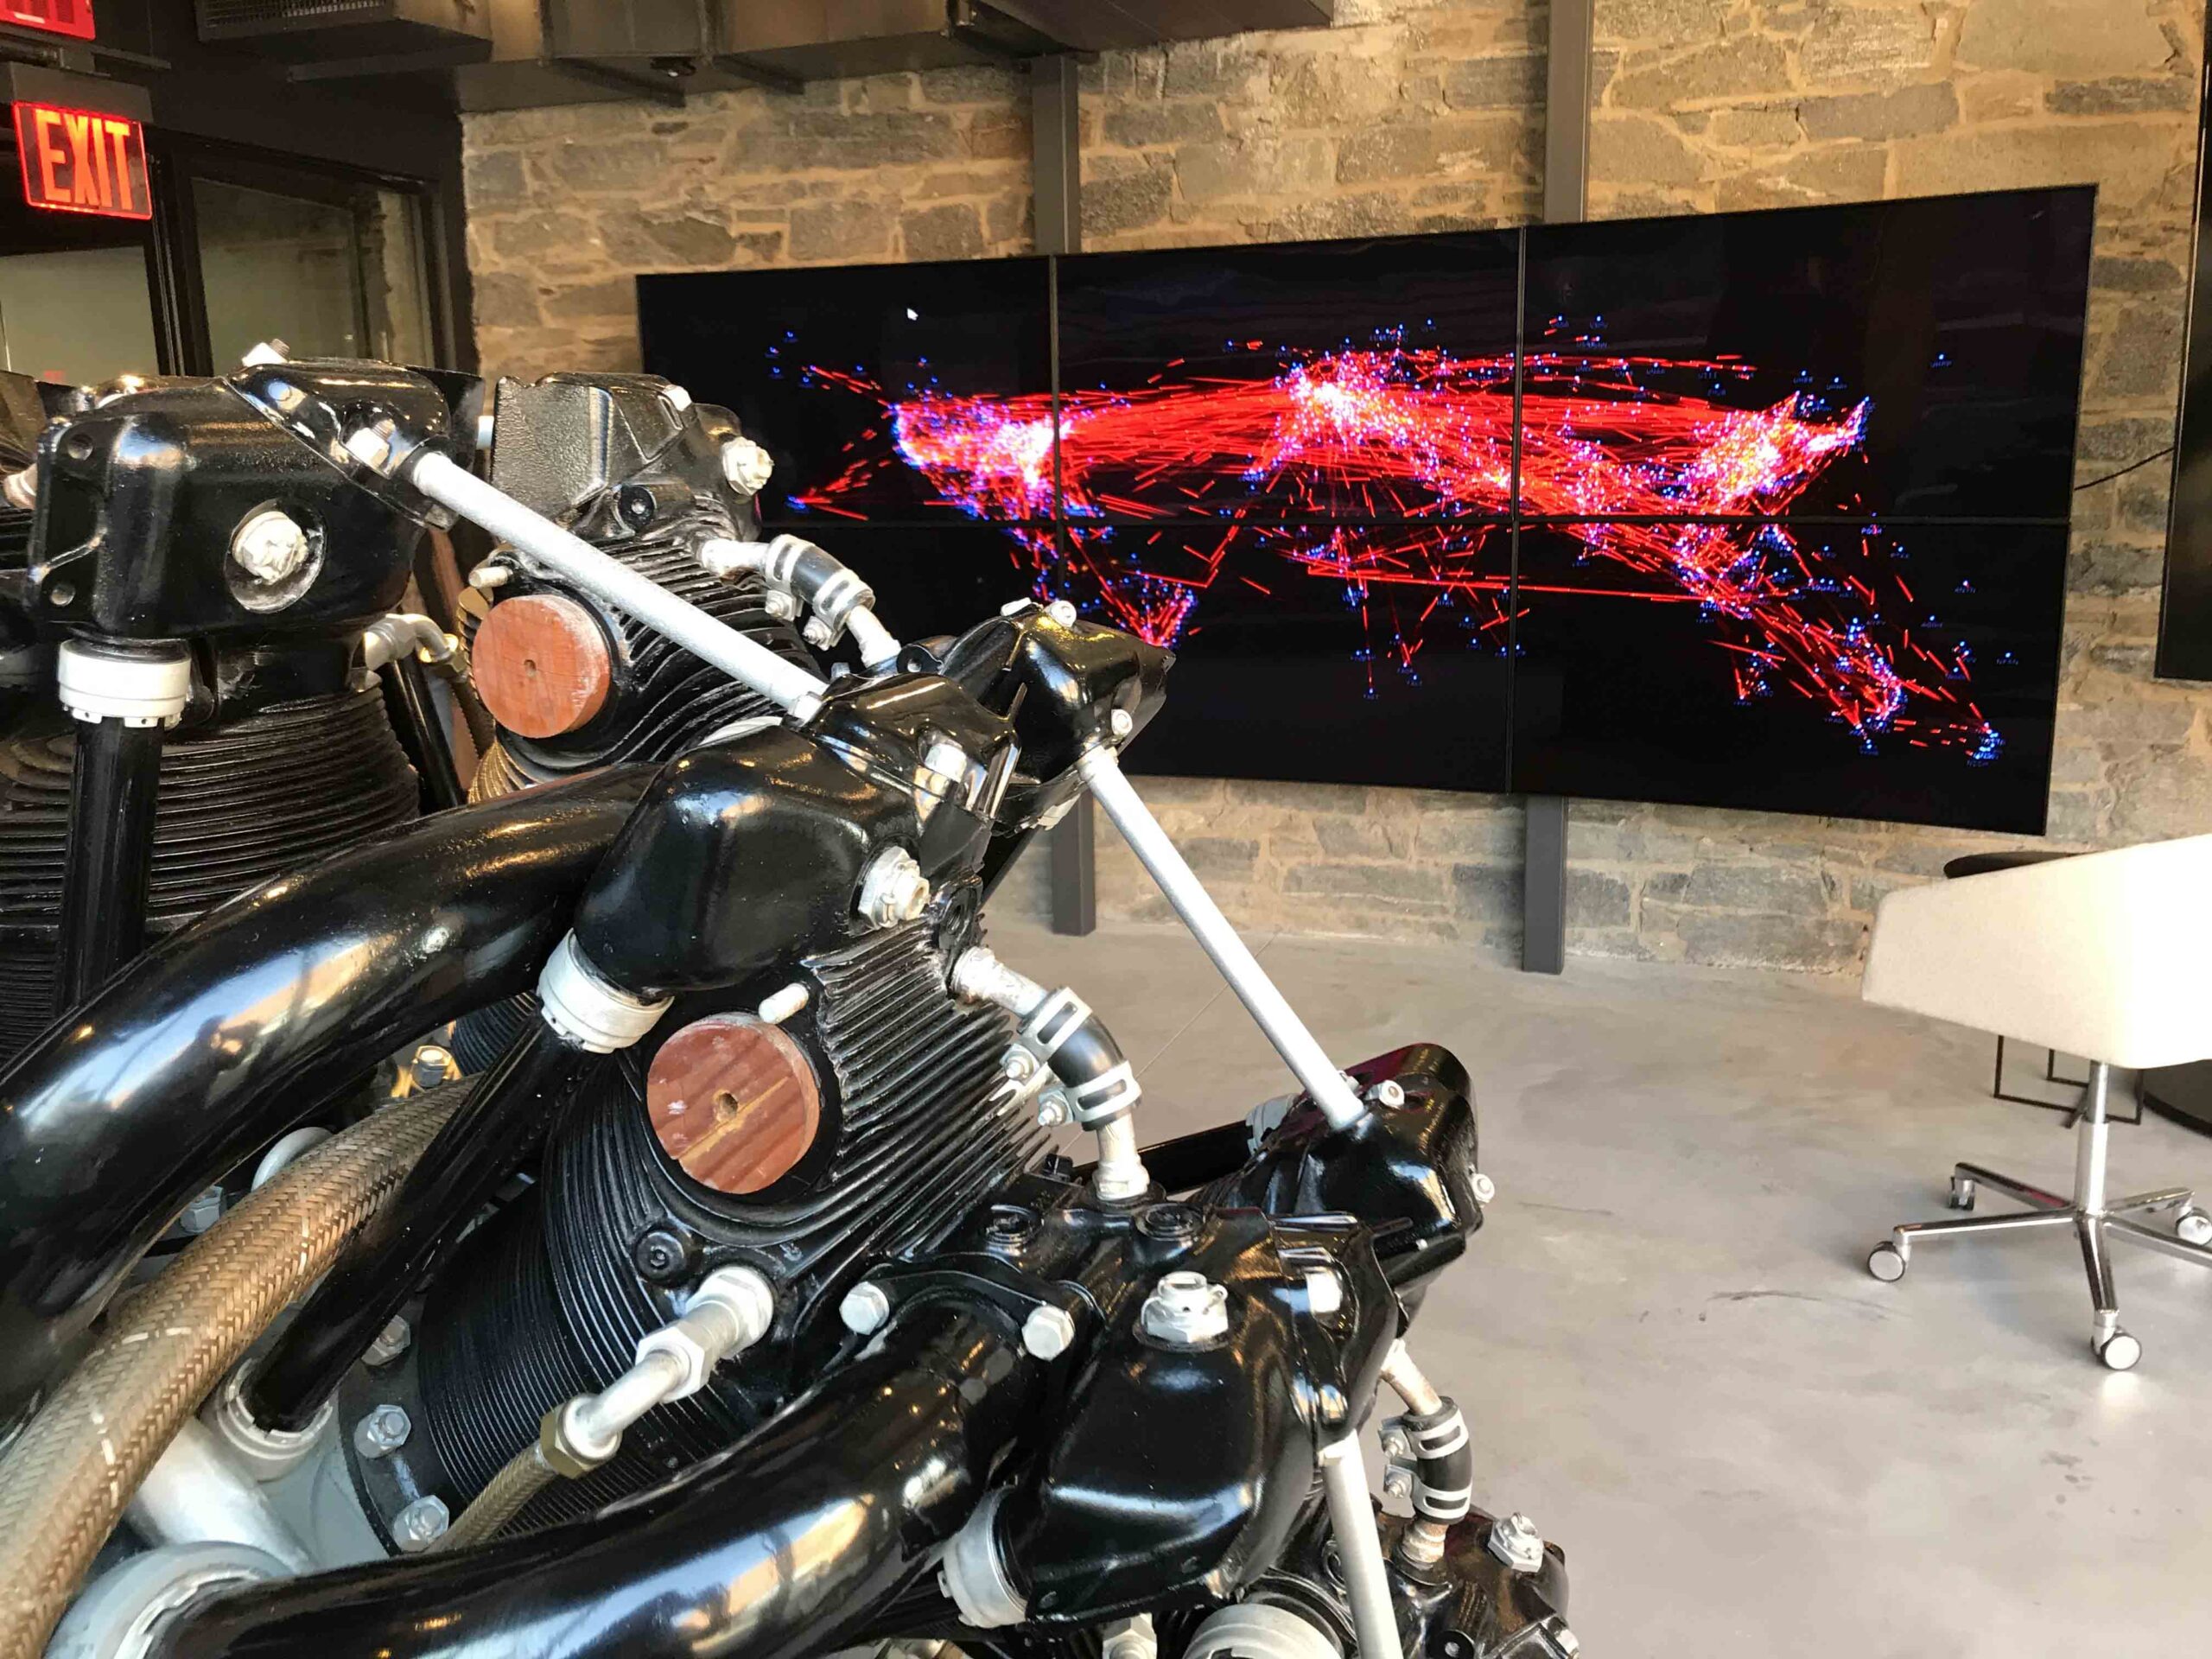
Our team collaborated with Raytheon Technologies for a data visualization project like no other. We were asked to create a compelling and memorable in-person experience using data visualizations in a unique section of Raytheon Technologies’ beautiful new office opening in their innovative Brooklyn (Dumbo) Accelerator Center. The area was by the Pratt & Whitney section and it utilized 6 Horizontal displays with touch capabilities for more interaction and information. It is the most photographed and Instagram-ed area of their entire facility and sits beside an actual Pratt & Whitney engine.
02
DISCOVERY PHASE
The first step was to understand Raytheon Technologies’ ethos and to visit the new space in Brooklyn. While visiting we met with specific stakeholders to hear about what goals they wanted to reach for the visualizations in the 2 spaces. We also needed to see the screens and get detailed specs of all the hardware we needed to use for the displays.

03
CONCEPT PHASE
Once we understood the project goals and specs, our creative team began to conceptualize. Our team wanted to find beauty in the design of the technology and data but also find ways to greet, inform and surprise the visitor.
In this phase we built a simple 3D model of the screens in order to test visual ideas quickly in a virtual “laboratory” before full scale testing and roll out.
Initial design frames

04
IMPRESSIONISTIC FLIGHT
This direction presents a sequence of beautiful scenes that each use data to generate breathtaking abstract images capturing the spirit of Raytheon Technologies. For instance, using data related to landing gear, various paths can be drawn across the screen tracing out landing trajectories for dozens, hundreds, or thousands of flights.
Concept globe frames
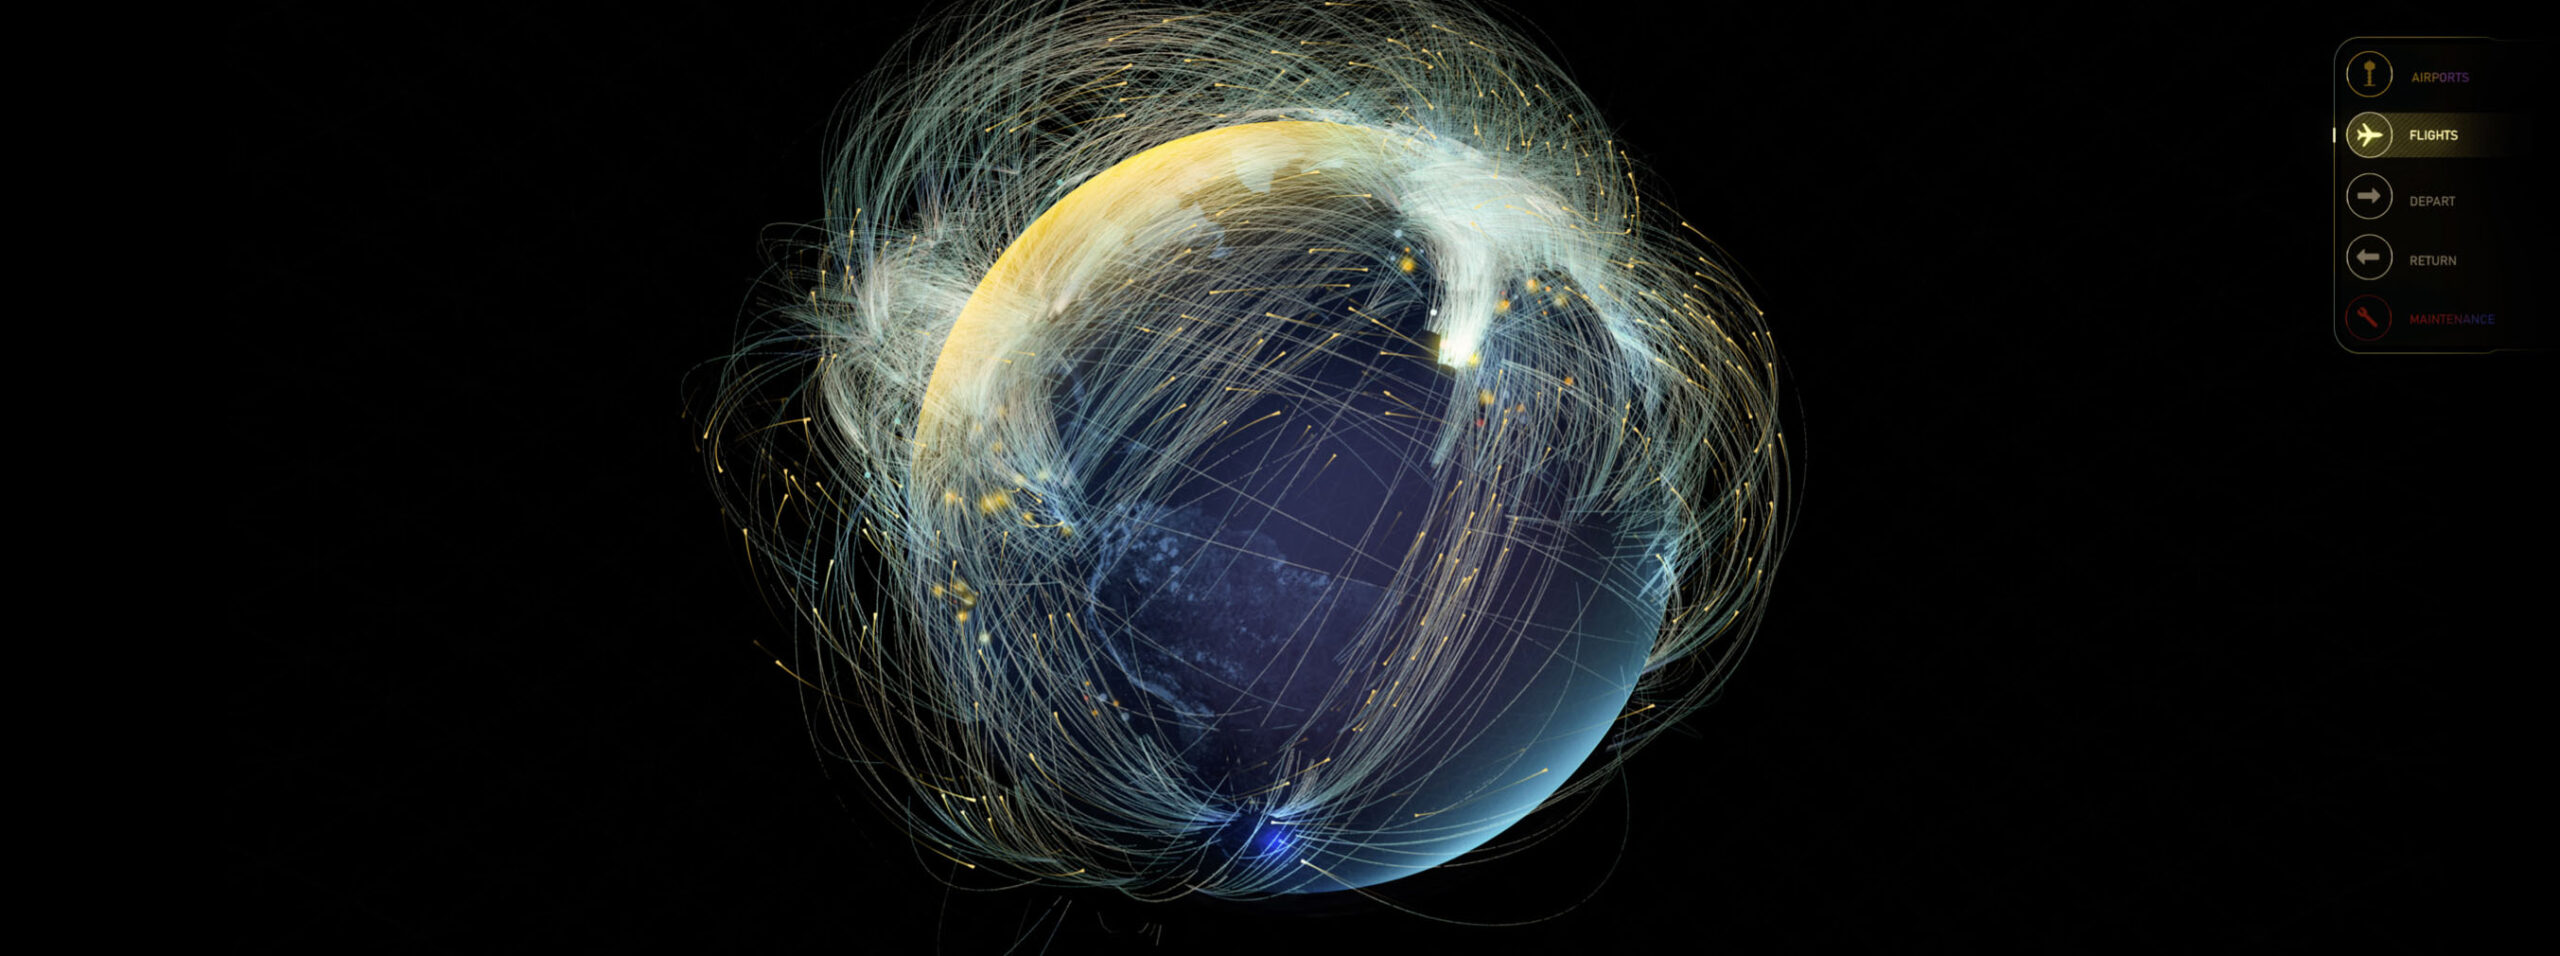
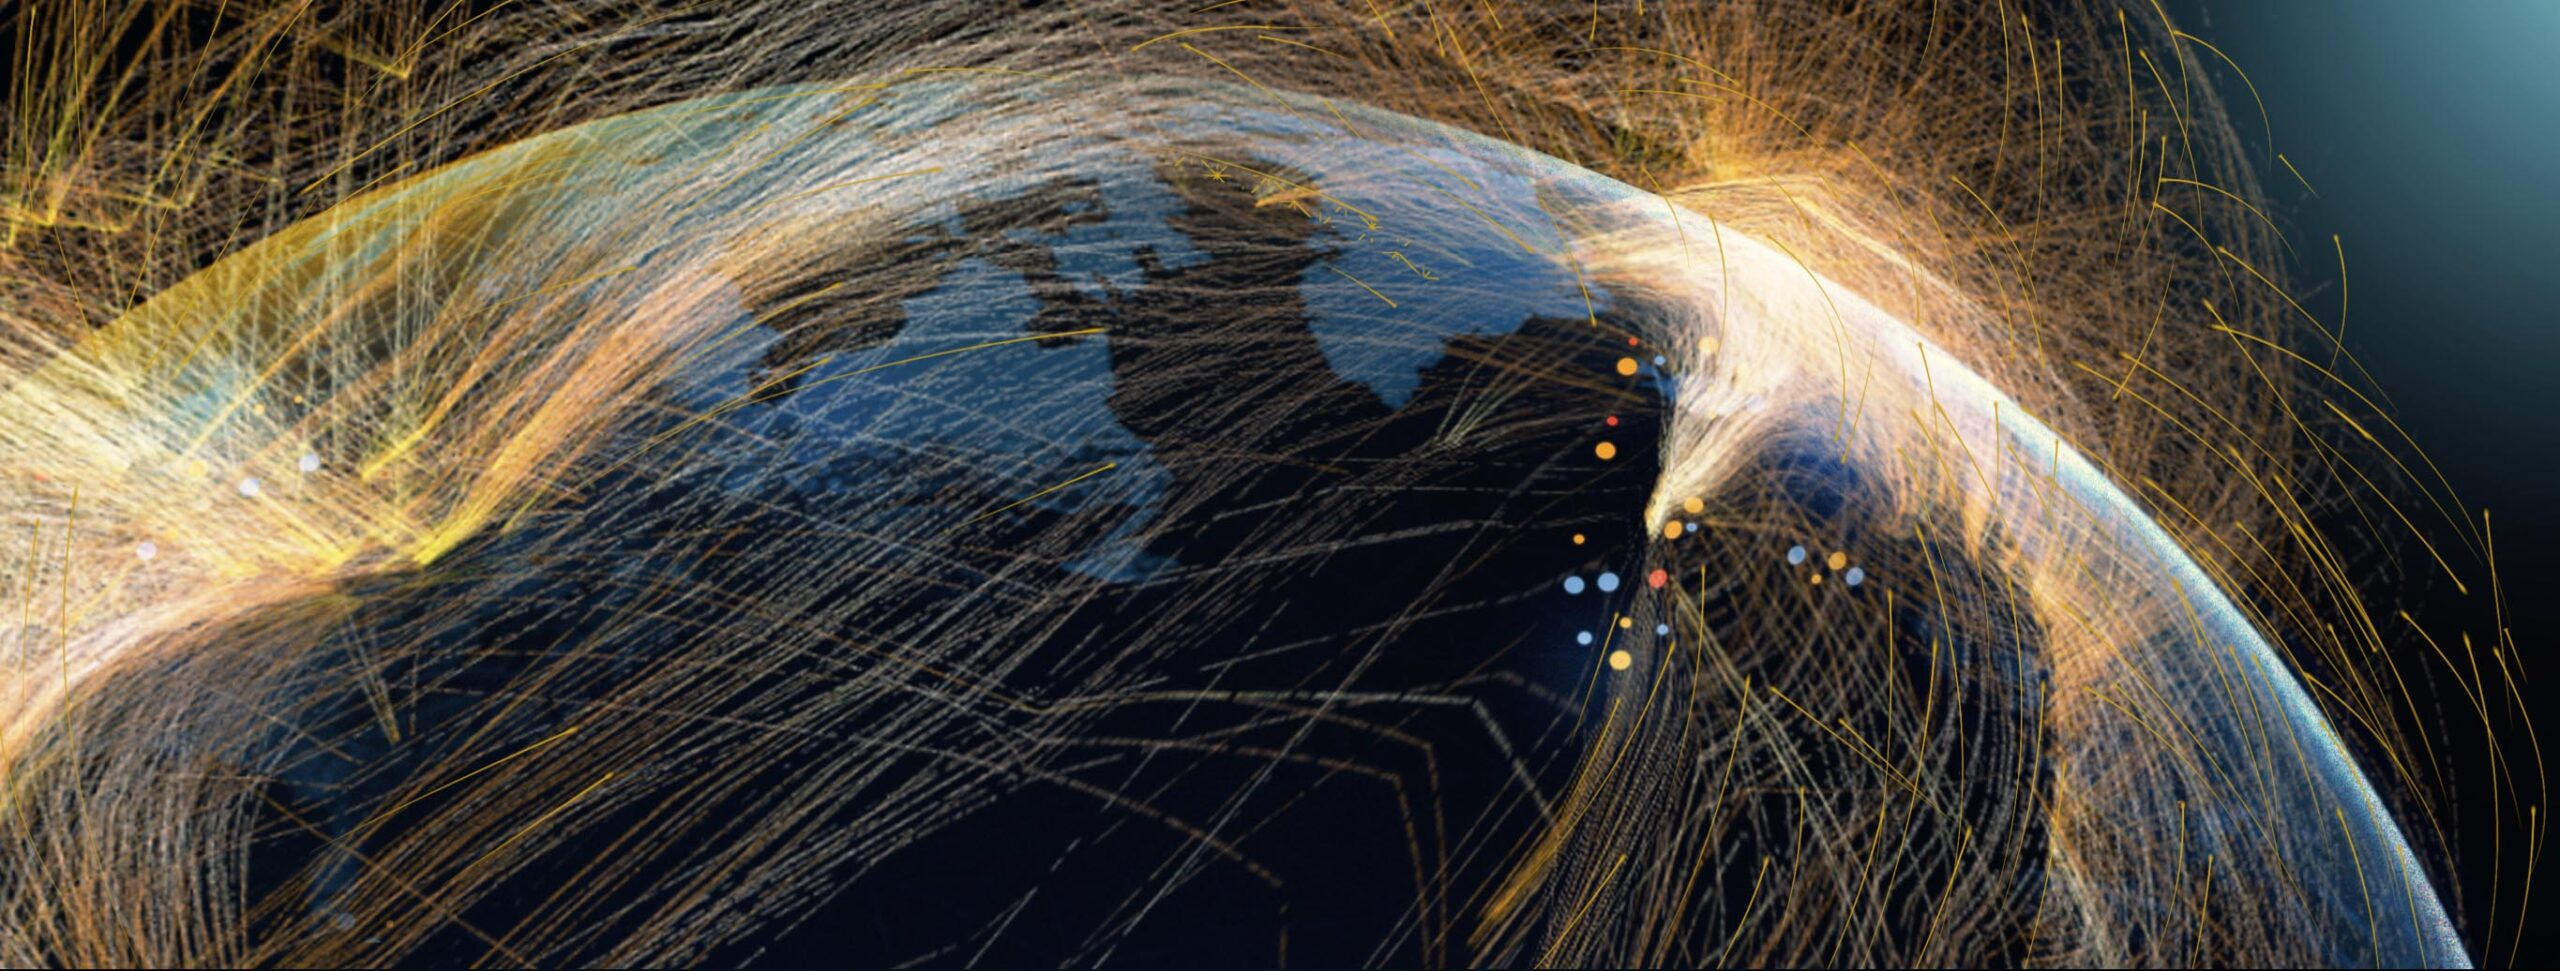
When using data based on cargo management, visualizations accumulate cubic forms implying the arrangement of various containers. Maintenance data (completed per-hour) can sweep across the radius of a turbine diagram. This approach emphasizes beautiful imagery presented in a way that supports Raytheon’s impressive metrics.
Iconography exploration
05
CAUSE & EFFECT
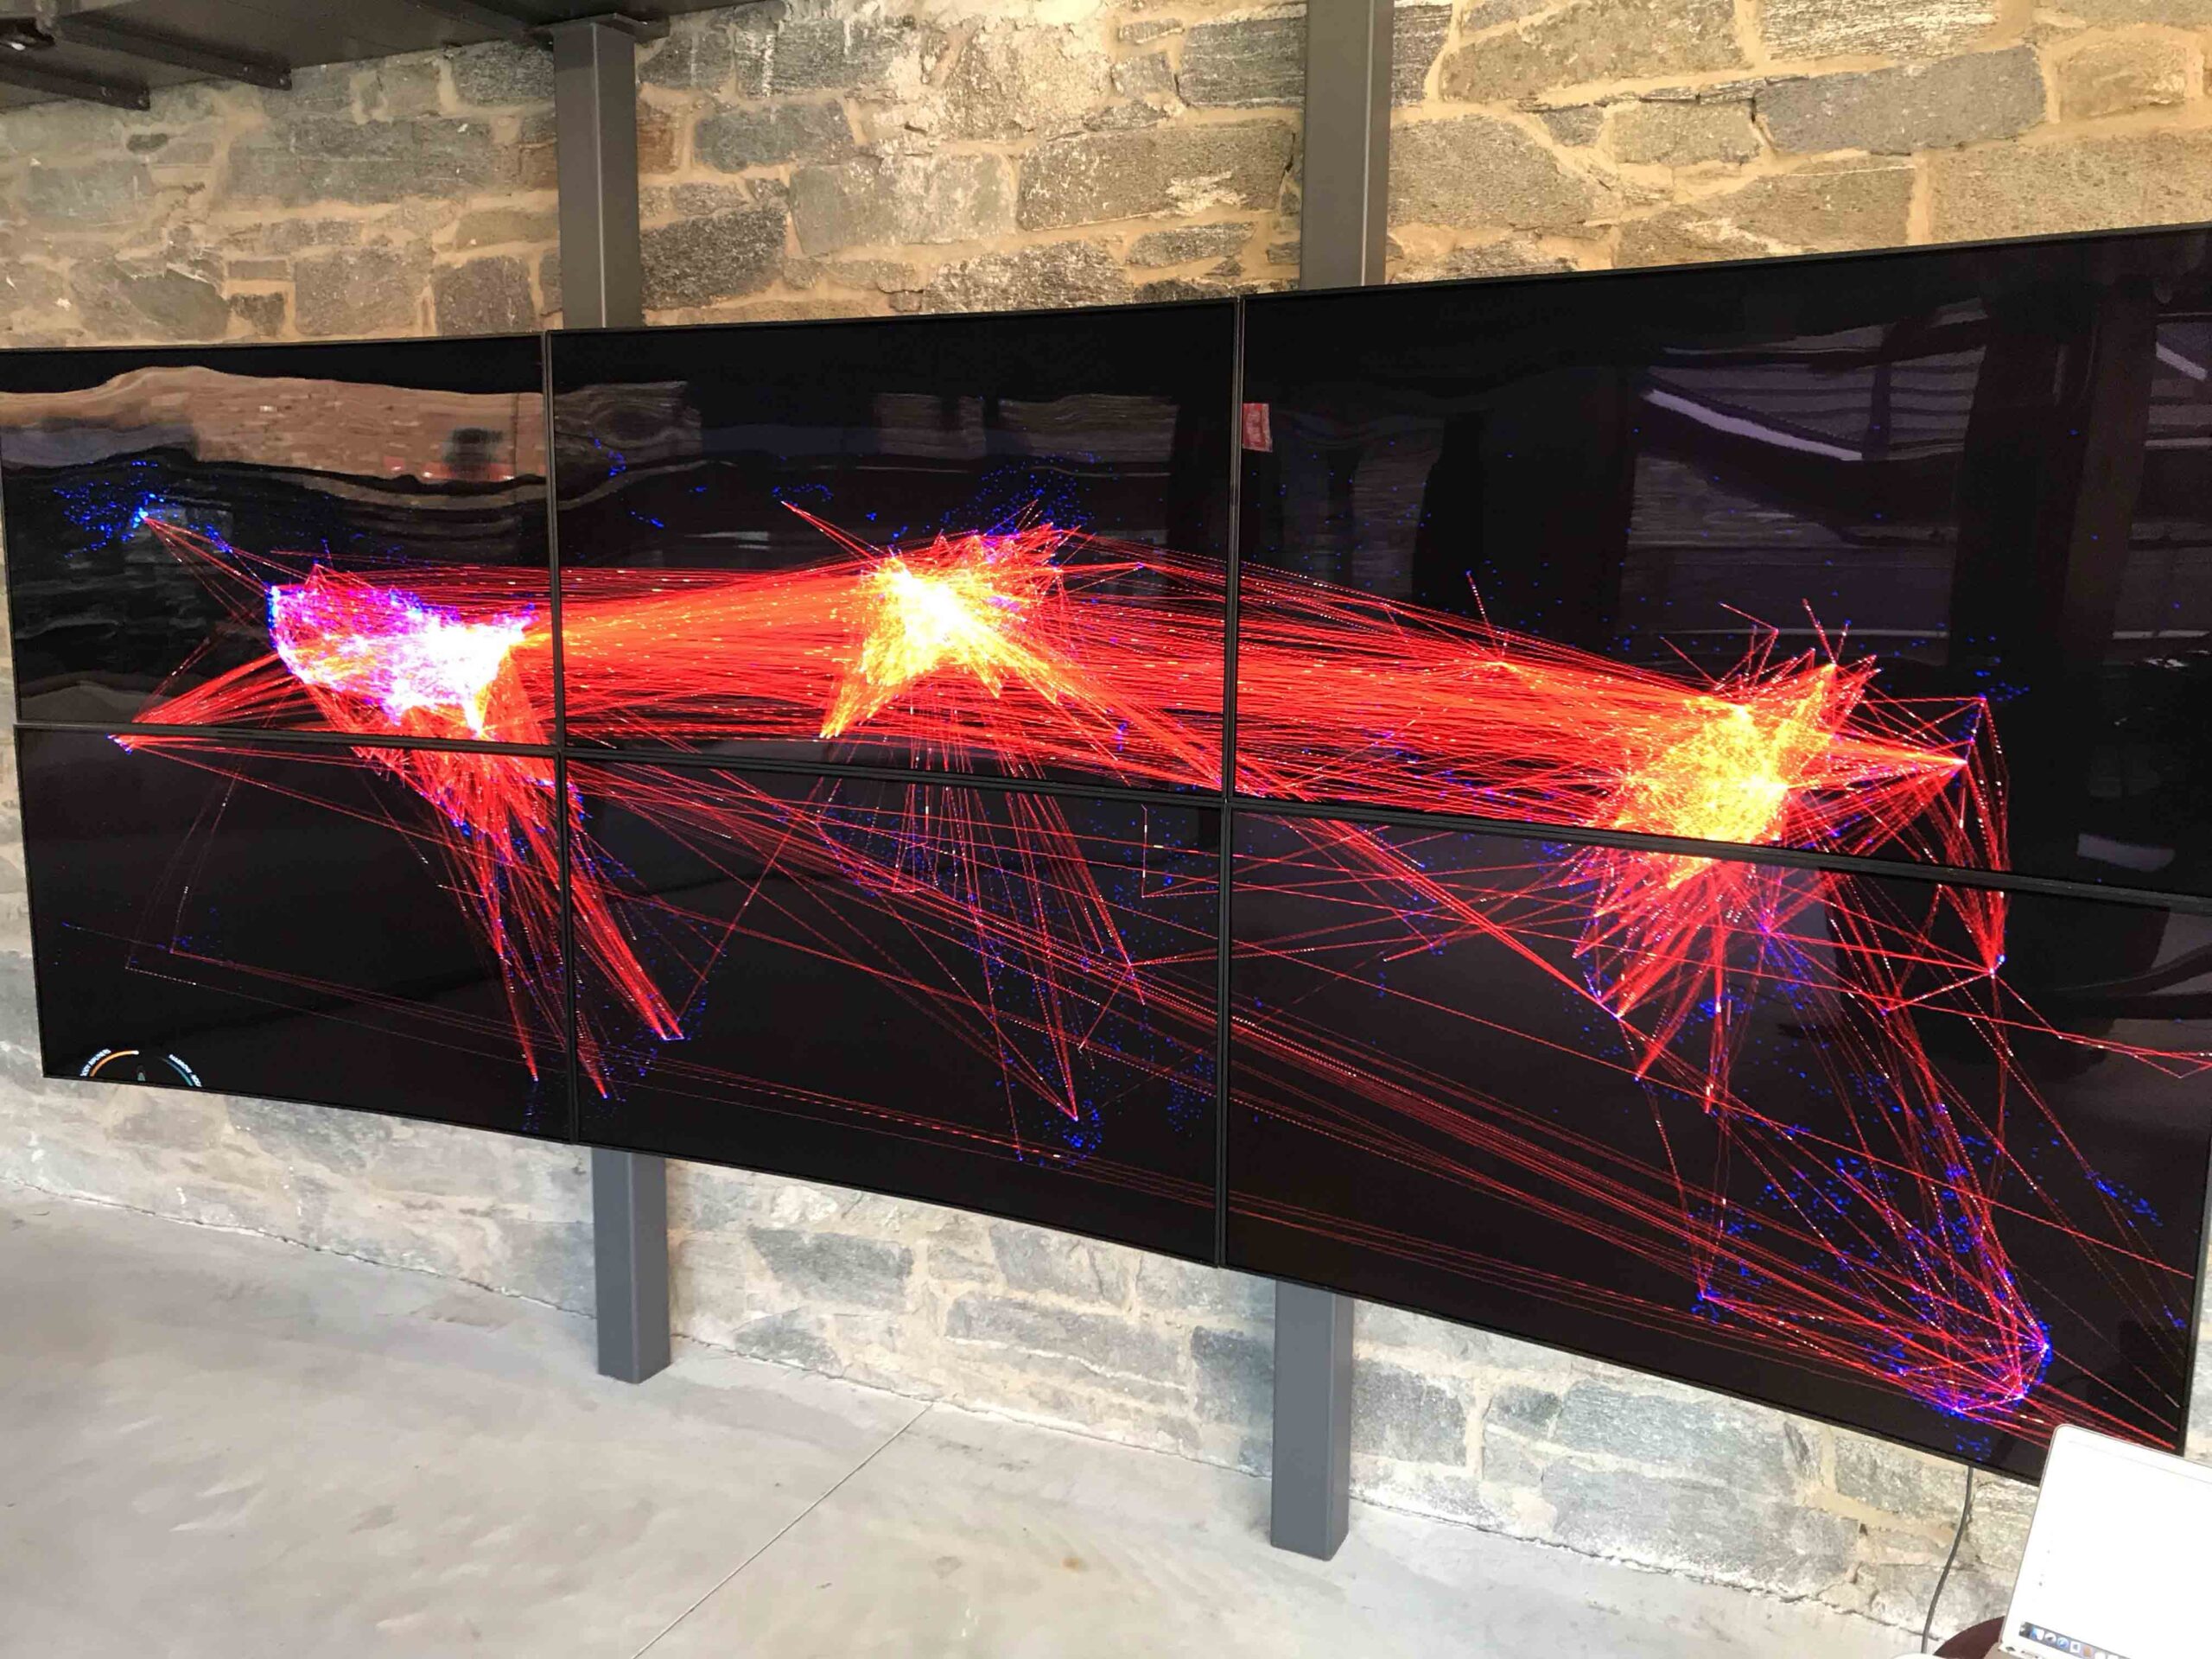
By positioning the display engine directly in front of the screen array, we can create visualizations that feel as though they are still feeling the ripples of Raytheon Technologies earliest innovations. By tying metrics (number of Raytheon-impacted flights in the air, etc.) to individual pathways tracing over the engine, we can create a display that presents itself as a wind-tunnel visualization over the engine itself.
06
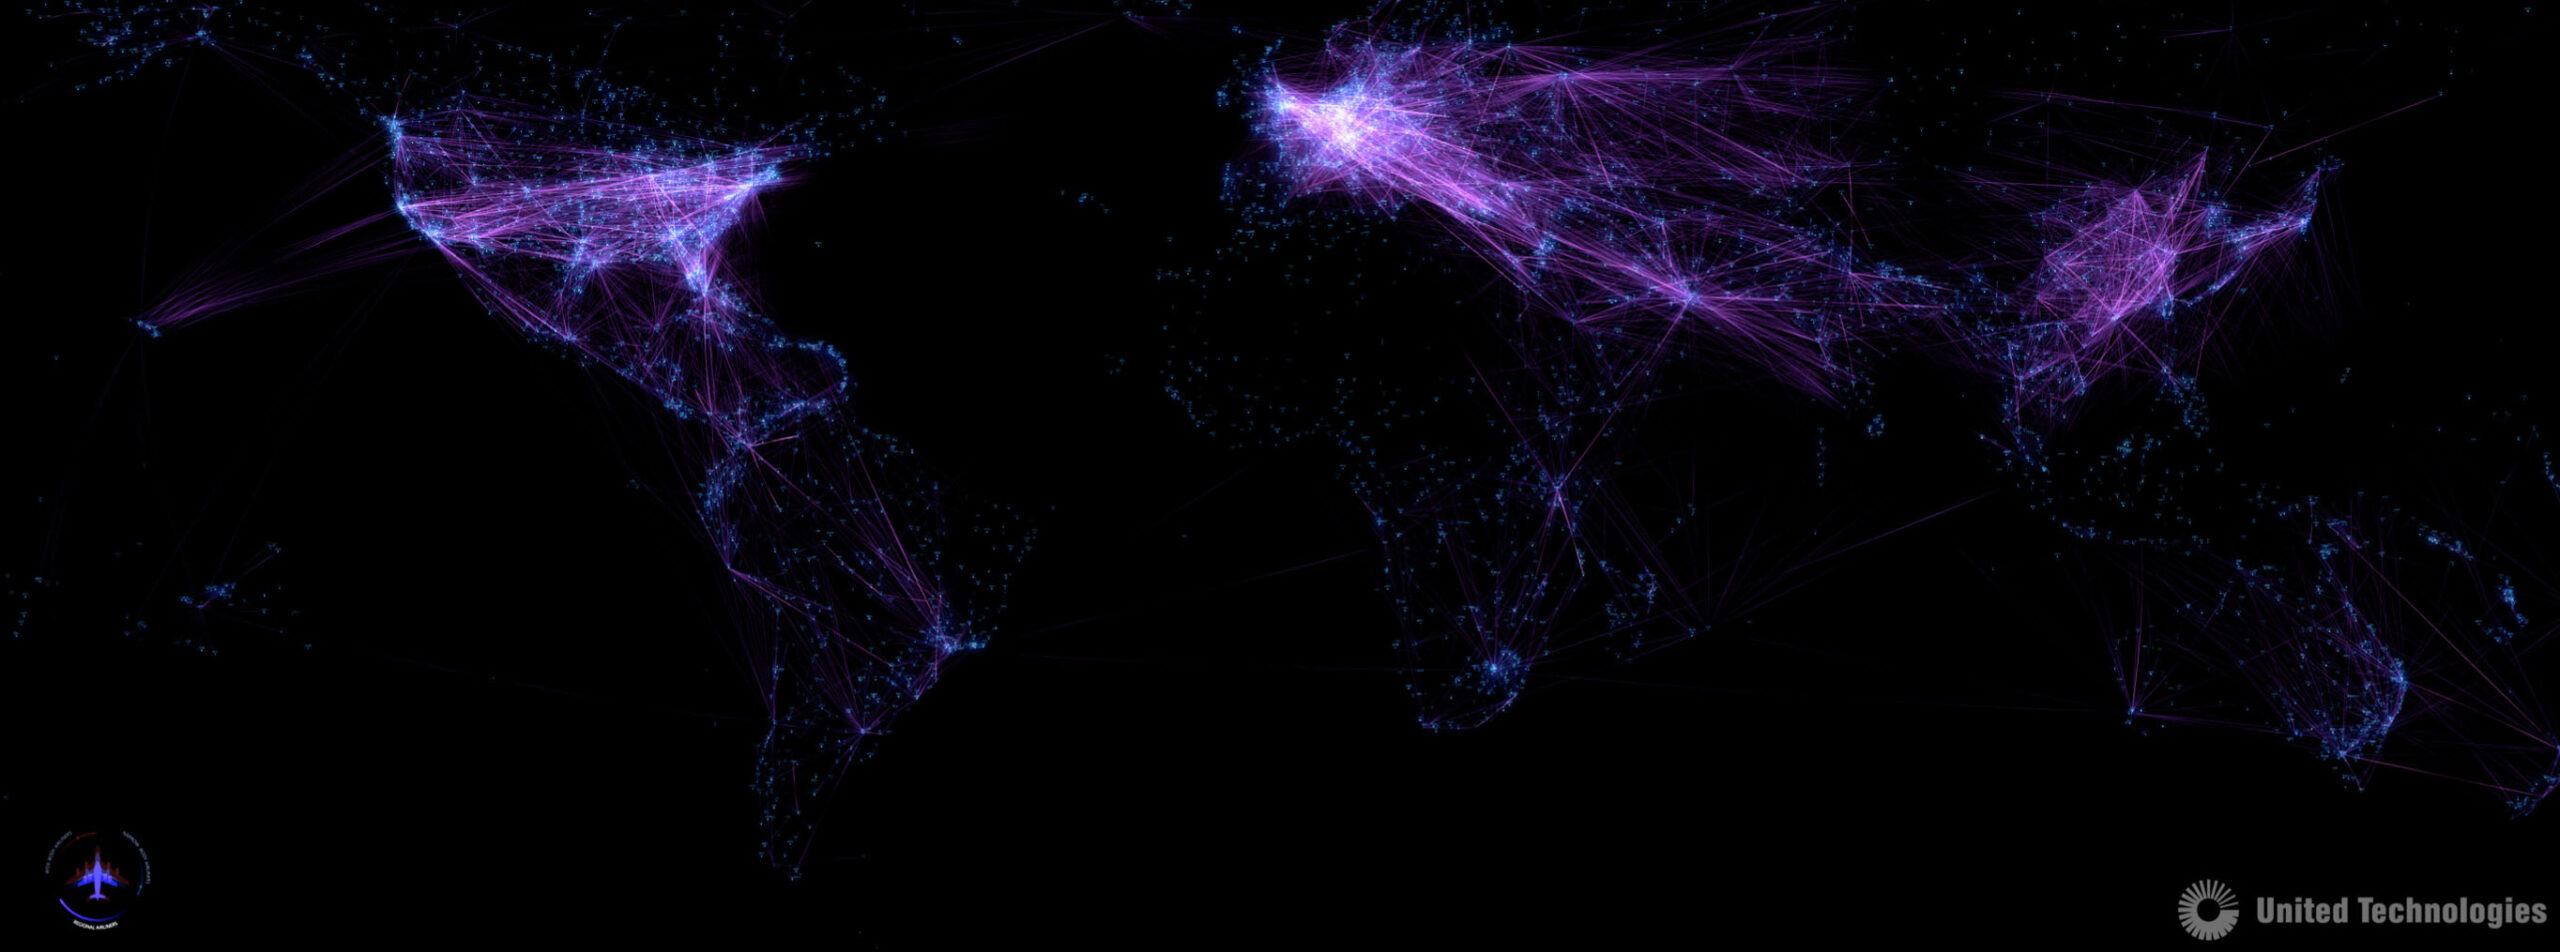
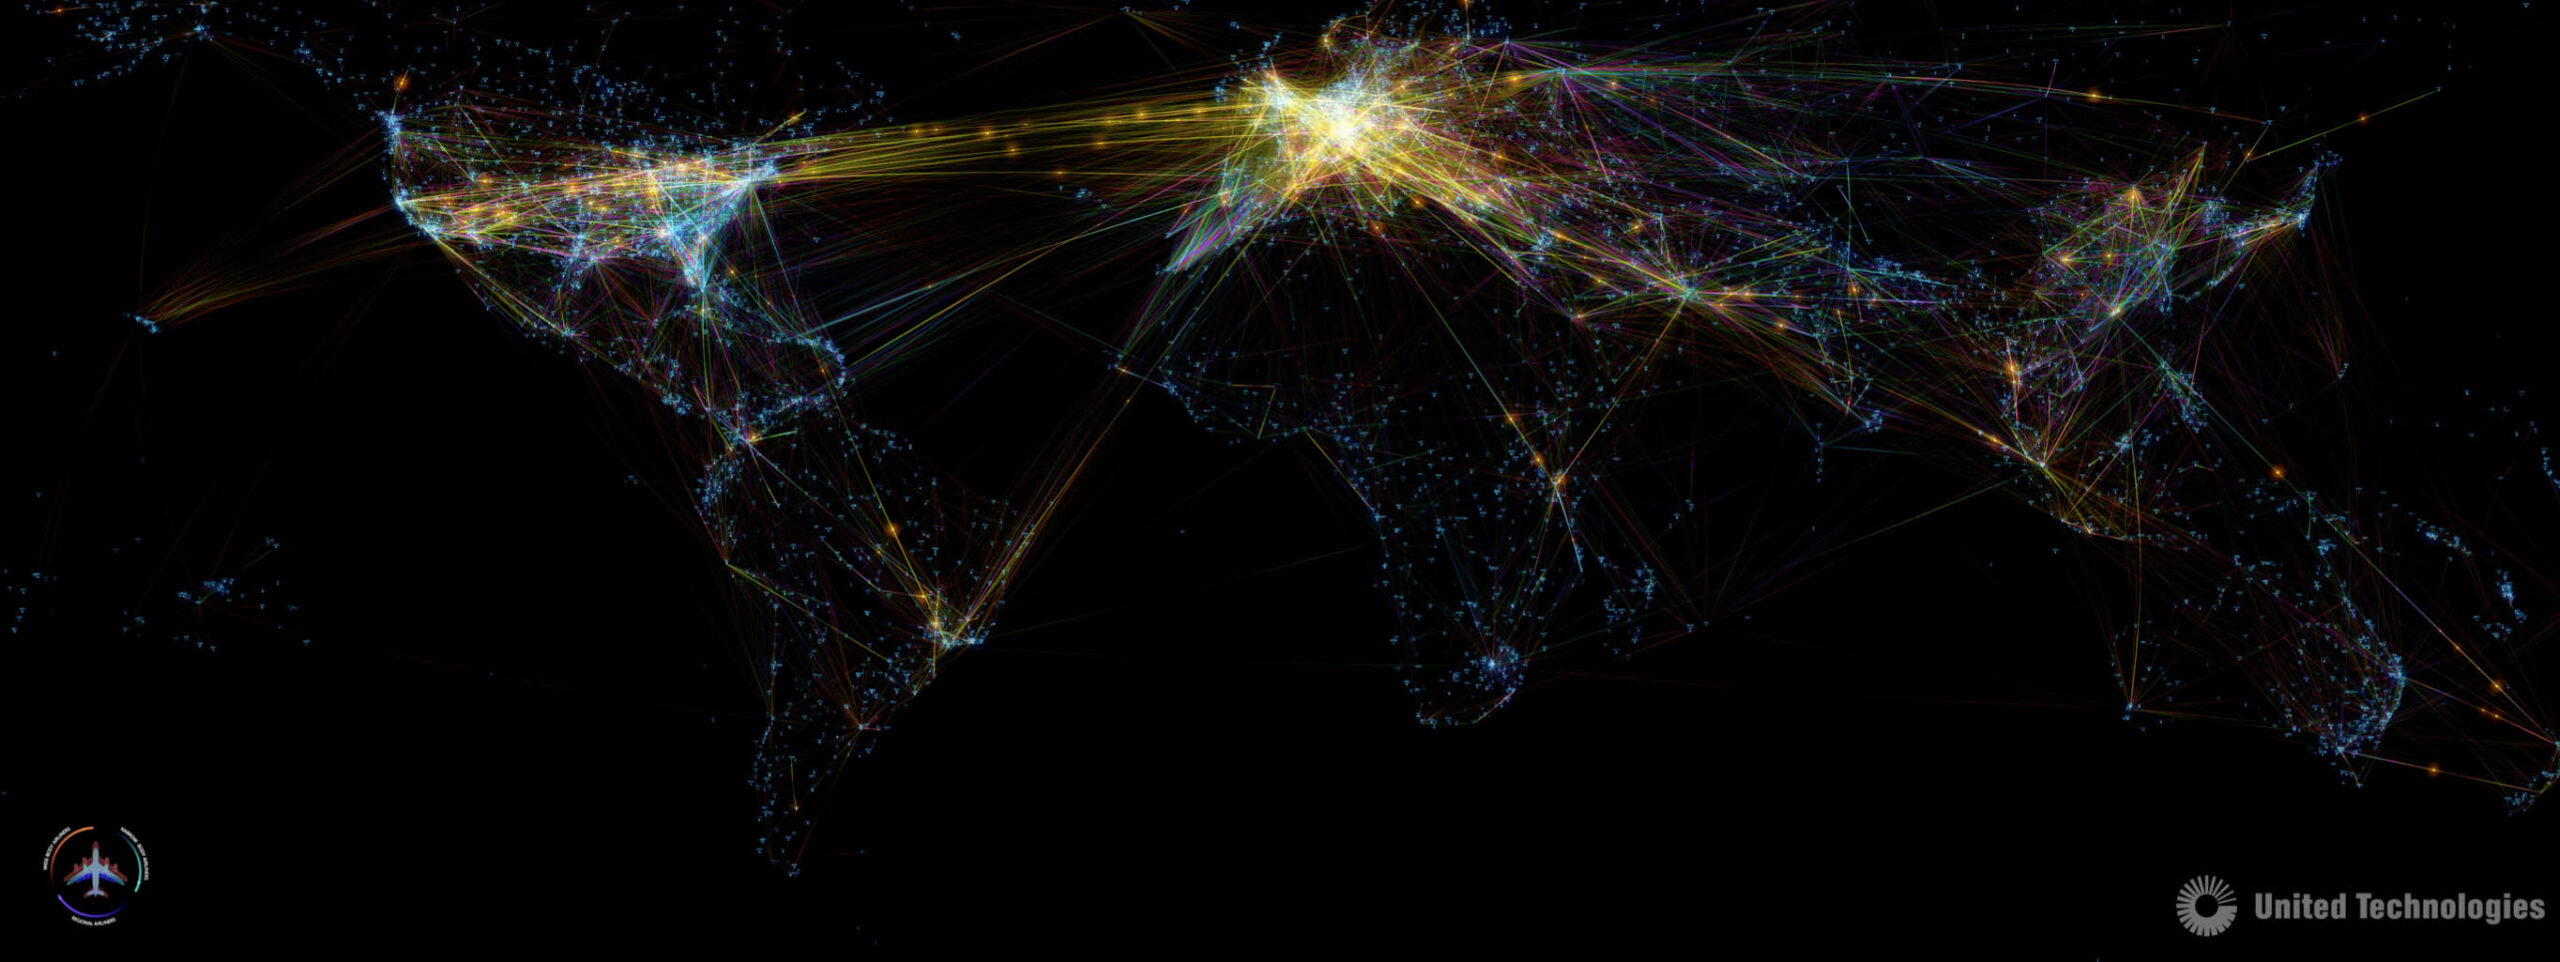
REAL TIME VISUALIZATIONS
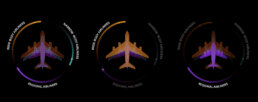
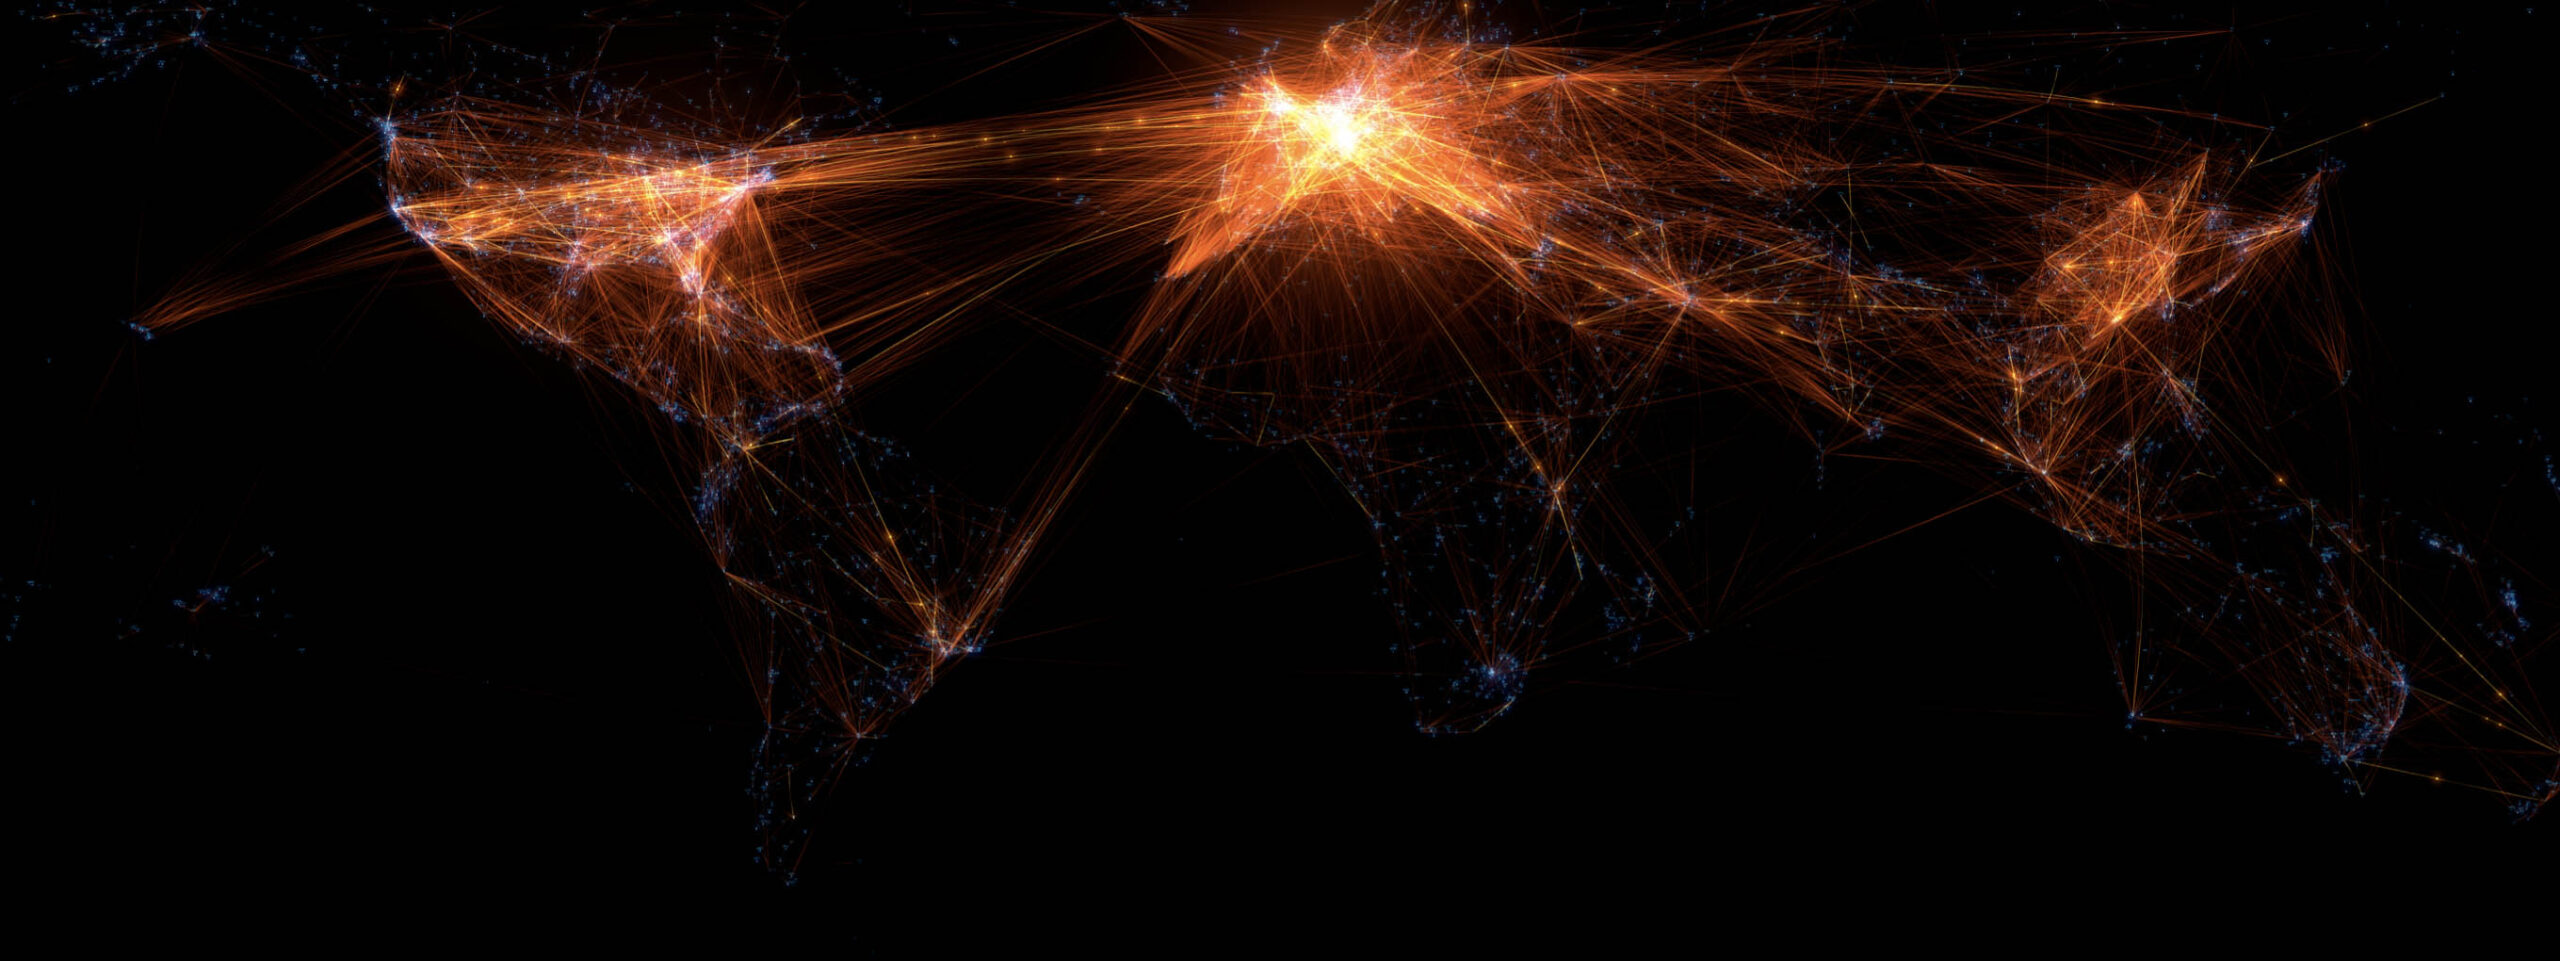
A map of the world is our canvas for displaying real time data of Raytheon Technologies’ aerospace initiatives across the globe. The display cycles through several different data points to showcase the live feed of air traffic using Raytheon Technologies jet engines. One scene would utilize flight tracking data that highlights real-time flight paths. Another scene would focus on take-off and landing points that ping at each location or MRO stations illuminated for each jet engine repair made. The feeds were also broken down in 3 categories for users to select, regional, wide-body and narrow-body. The user also had the ability to view all of the airliners to see a beautiful array of colors and flight paths light up the screens.
Other concepts we developed came from our research and wanting to use public facing metrics. For example, visualizing the number of people transported by Raytheon Technologies technology or the number of people employed because of Raytheon. Each highlight, ping, and data point could also be used to reveal the map beneath it to represent how Raytheon is helping us find our way around the globe.
To build the visualizations we used open source (Safe) data like Flight Aware and others to gather all our information. From there we programmed each screen to showcase our designs from the data in the two different areas of the office.
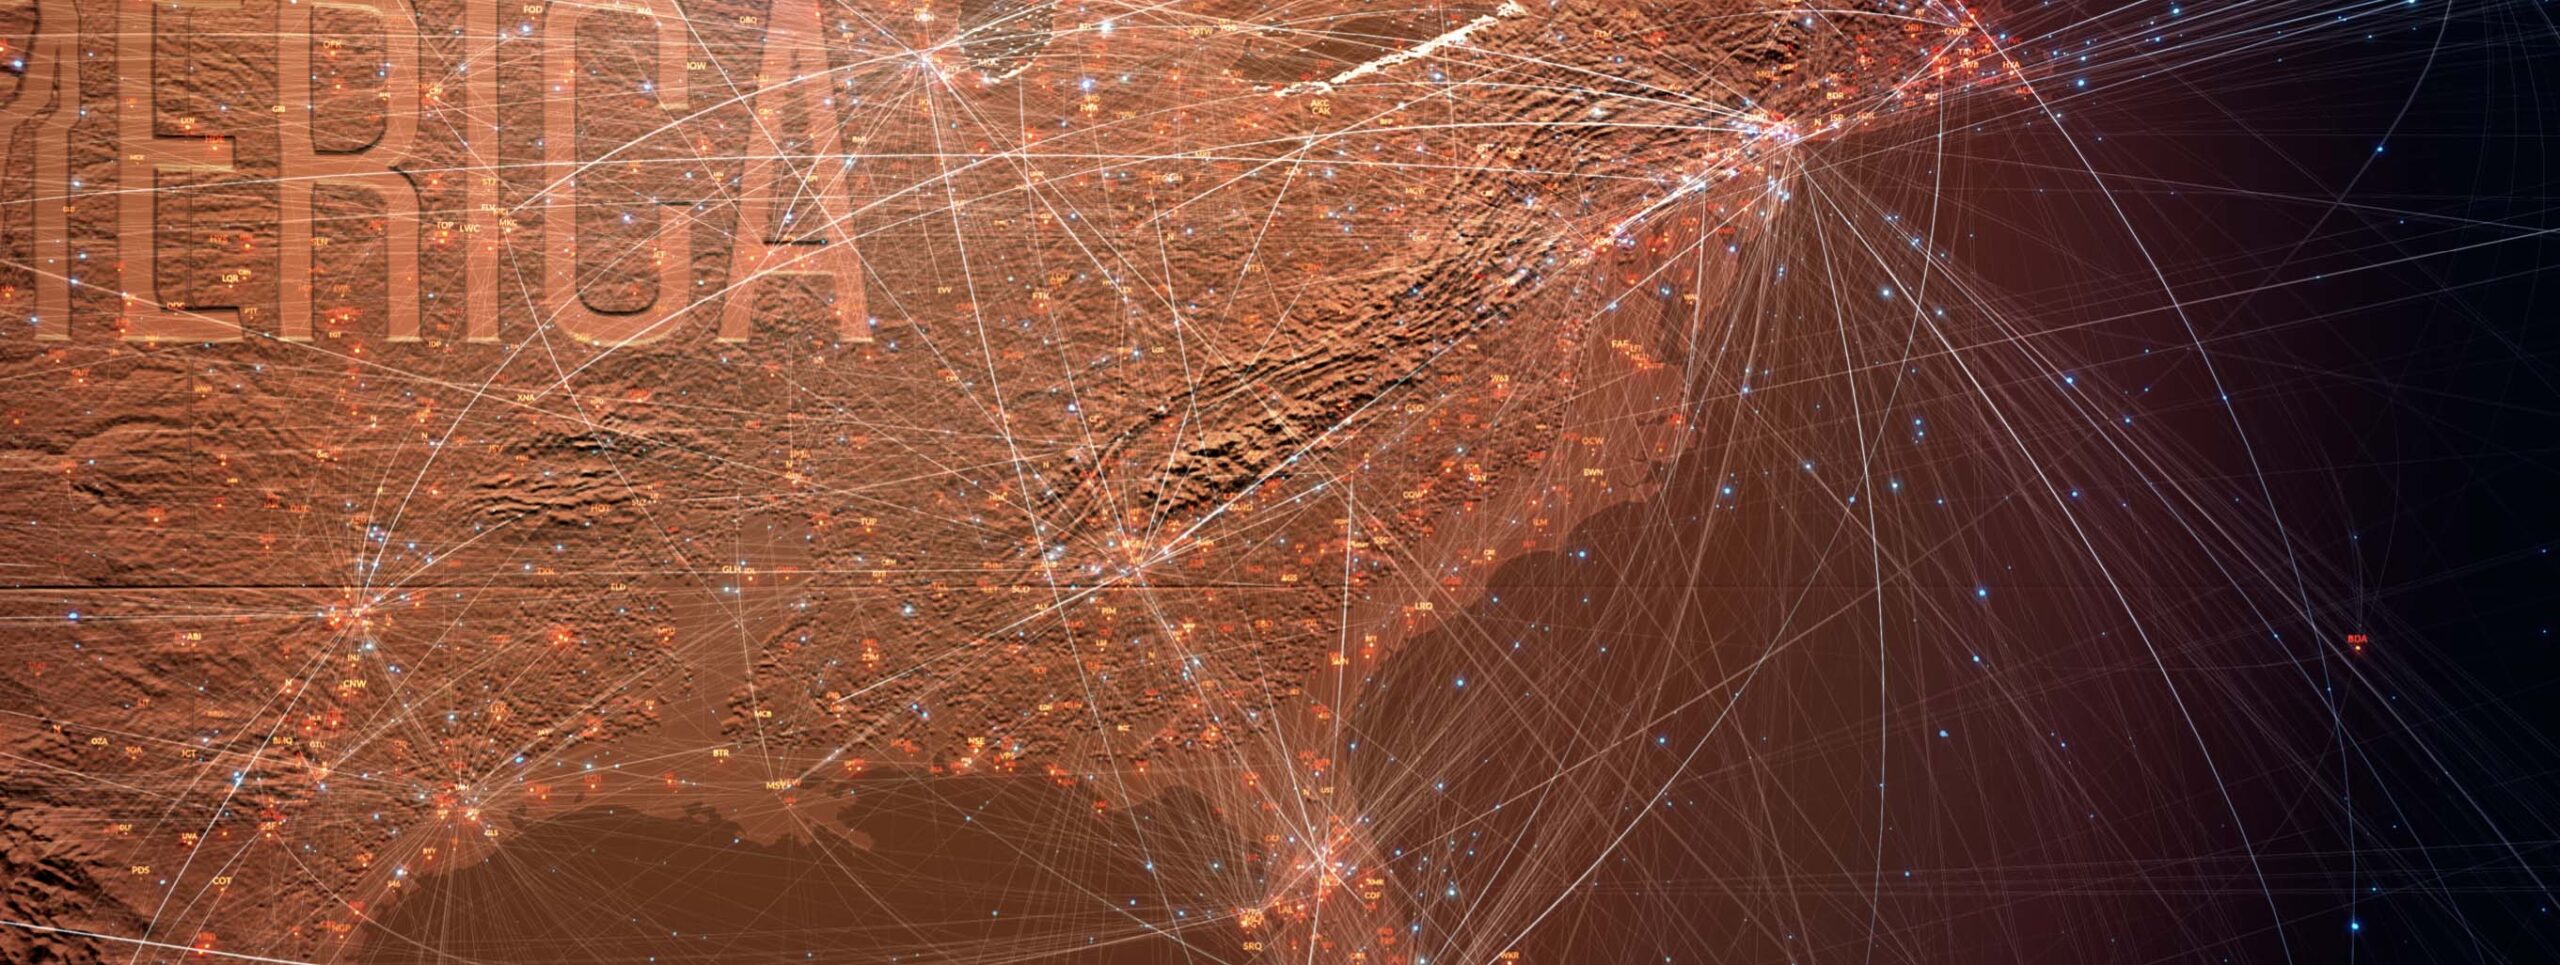
The Pratt & Whitney Display gave our team a chance to tell a longer form narrative through design, especially since these screens were more approachable and capable of touch interaction. We selected specific narratives for these experiences based on Raytheon Technologies brand attributes which involved Movement (aerospace) Safety and Comfort (building systems)
Final design

07
CONCLUSION
Raytheon Technologies accelerator proudly displays the visualization we crafted. These visualizations are evergreen since they receive updated data from the open source feed we created. Our collaboration with the team at Raytheon Technologies was incredible and the result was extremely unique to the Raytheon brand.