01
INTRODUCTION
Our team at Perception collaborated with Meraglim to envision the user interfaces of their new financial software, Raven. Raven is an online financial crisis management tool that produces a predictive analysis of financial trends based on information that the user inputs and global events that are occurring, charged by AI. Our team conceptualized the design, layout and user experience of this critical financial tool.
Meraglim Raven Design Overview
02
COLLABORATIVE RESEARCH
We began our work on Raven with collaborative research workshops with the Meraglim team, leveraging both internal evaluations and market research. These workshops were used to define high level features, such as detailed user stories, to provide the most value to the users of this online tool. Using workshop research, we prioritized the recorded features in order to identify the most viable needs of the product. This research helped guide our designs which resulted in a roadmap of recommendations for the initial product release and future updates to the Raven platform.
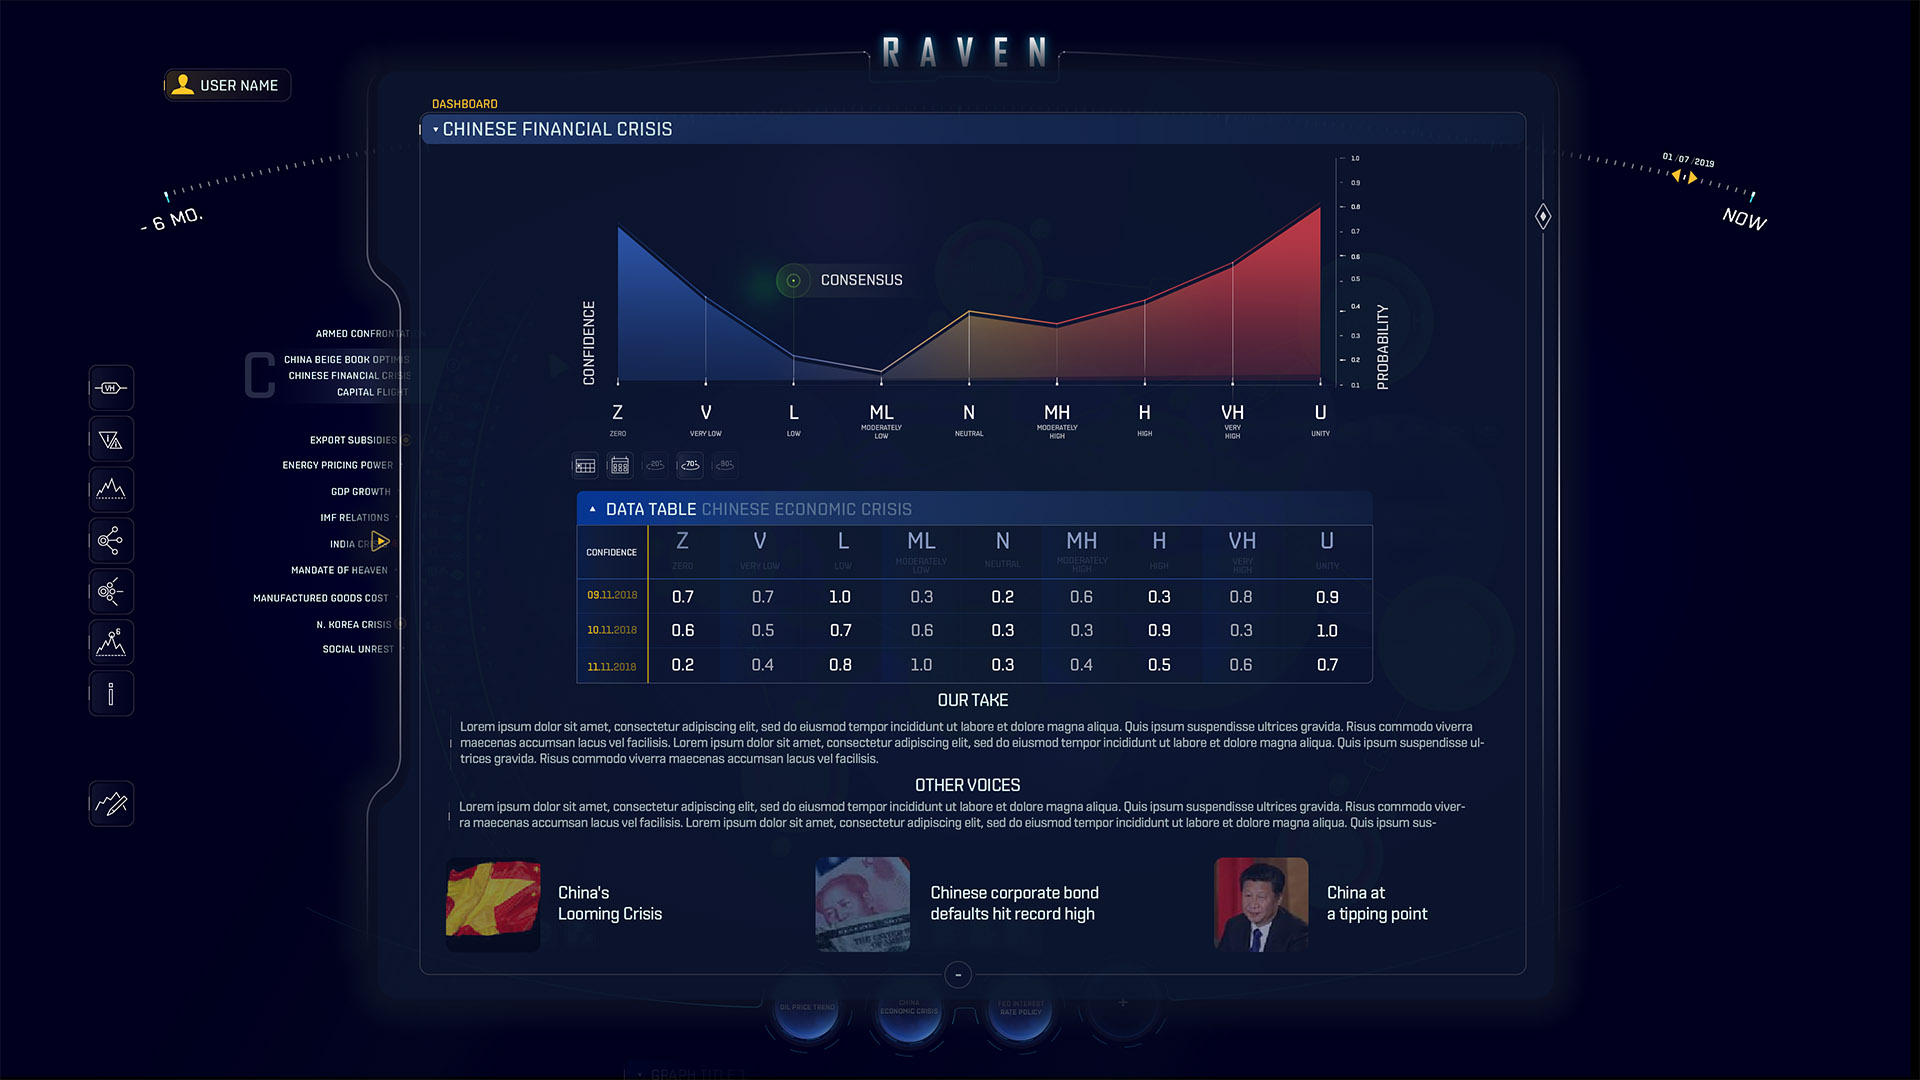
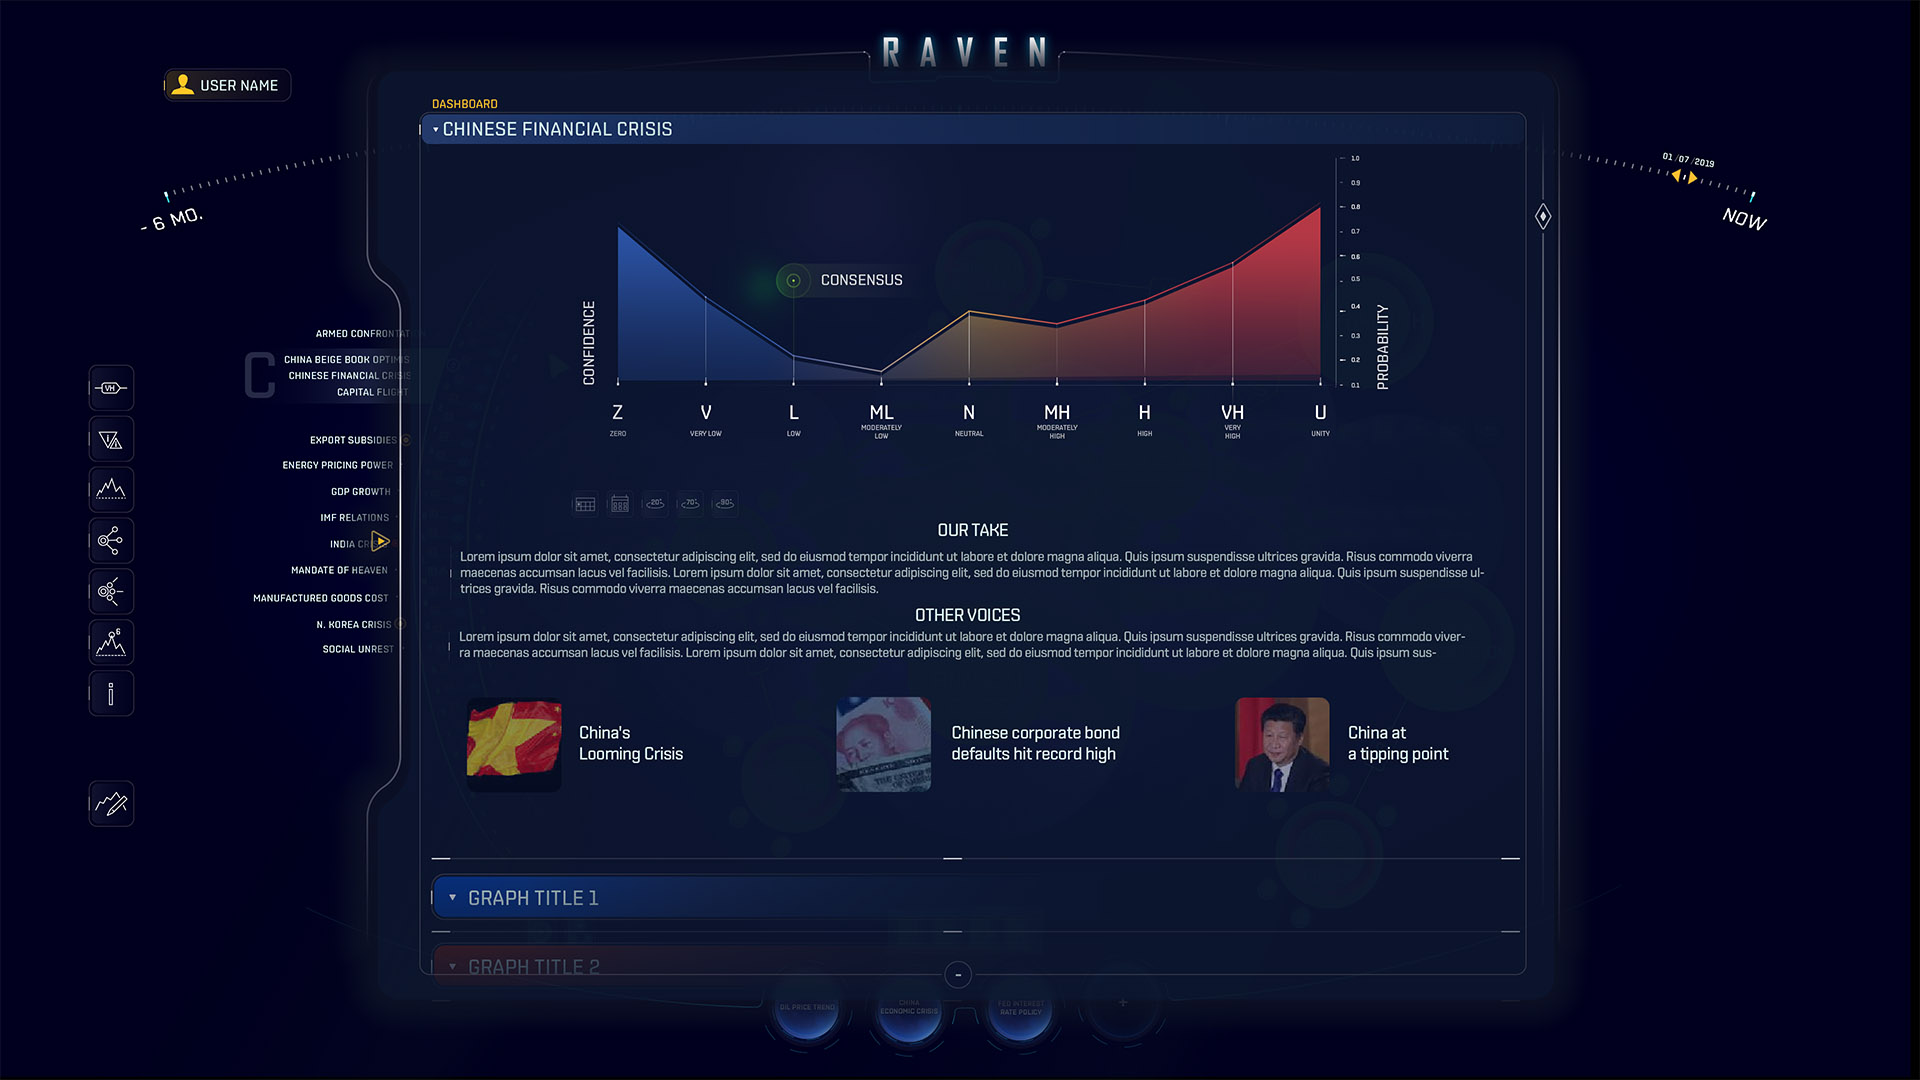
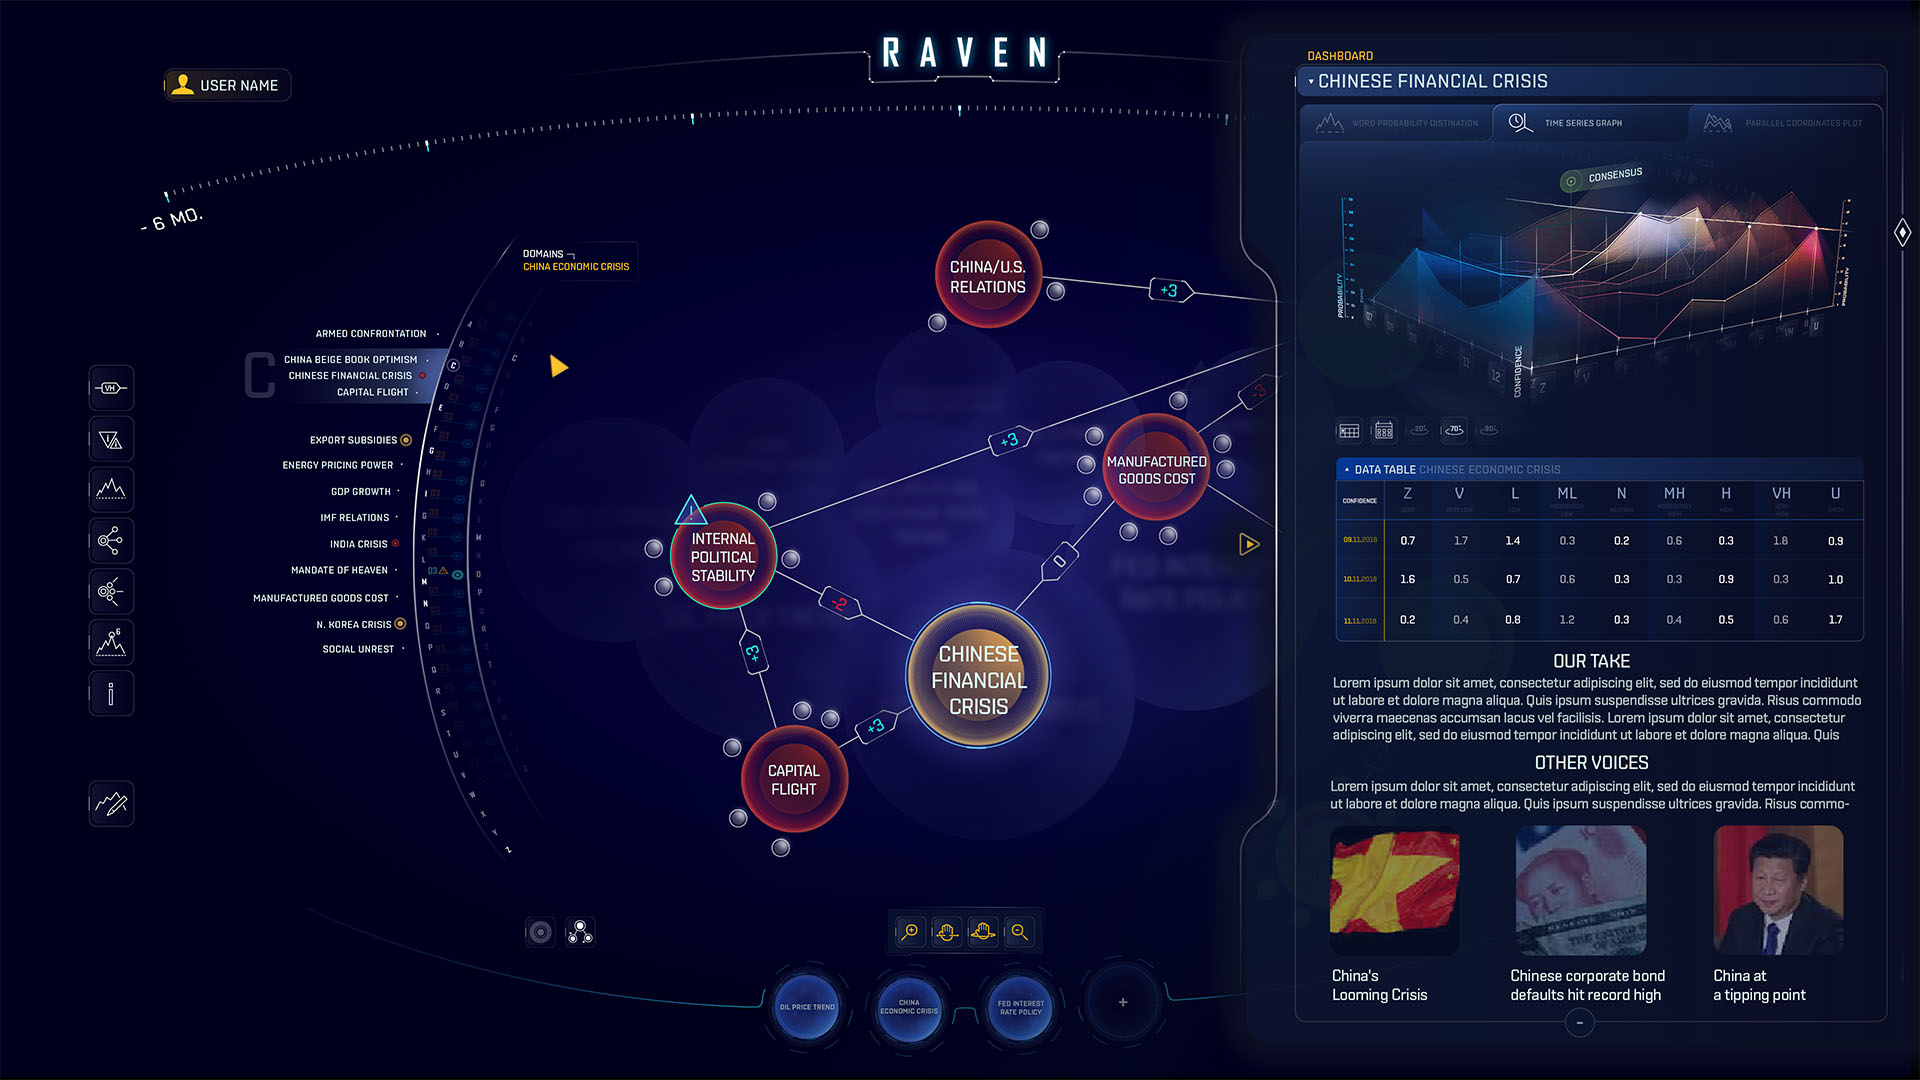
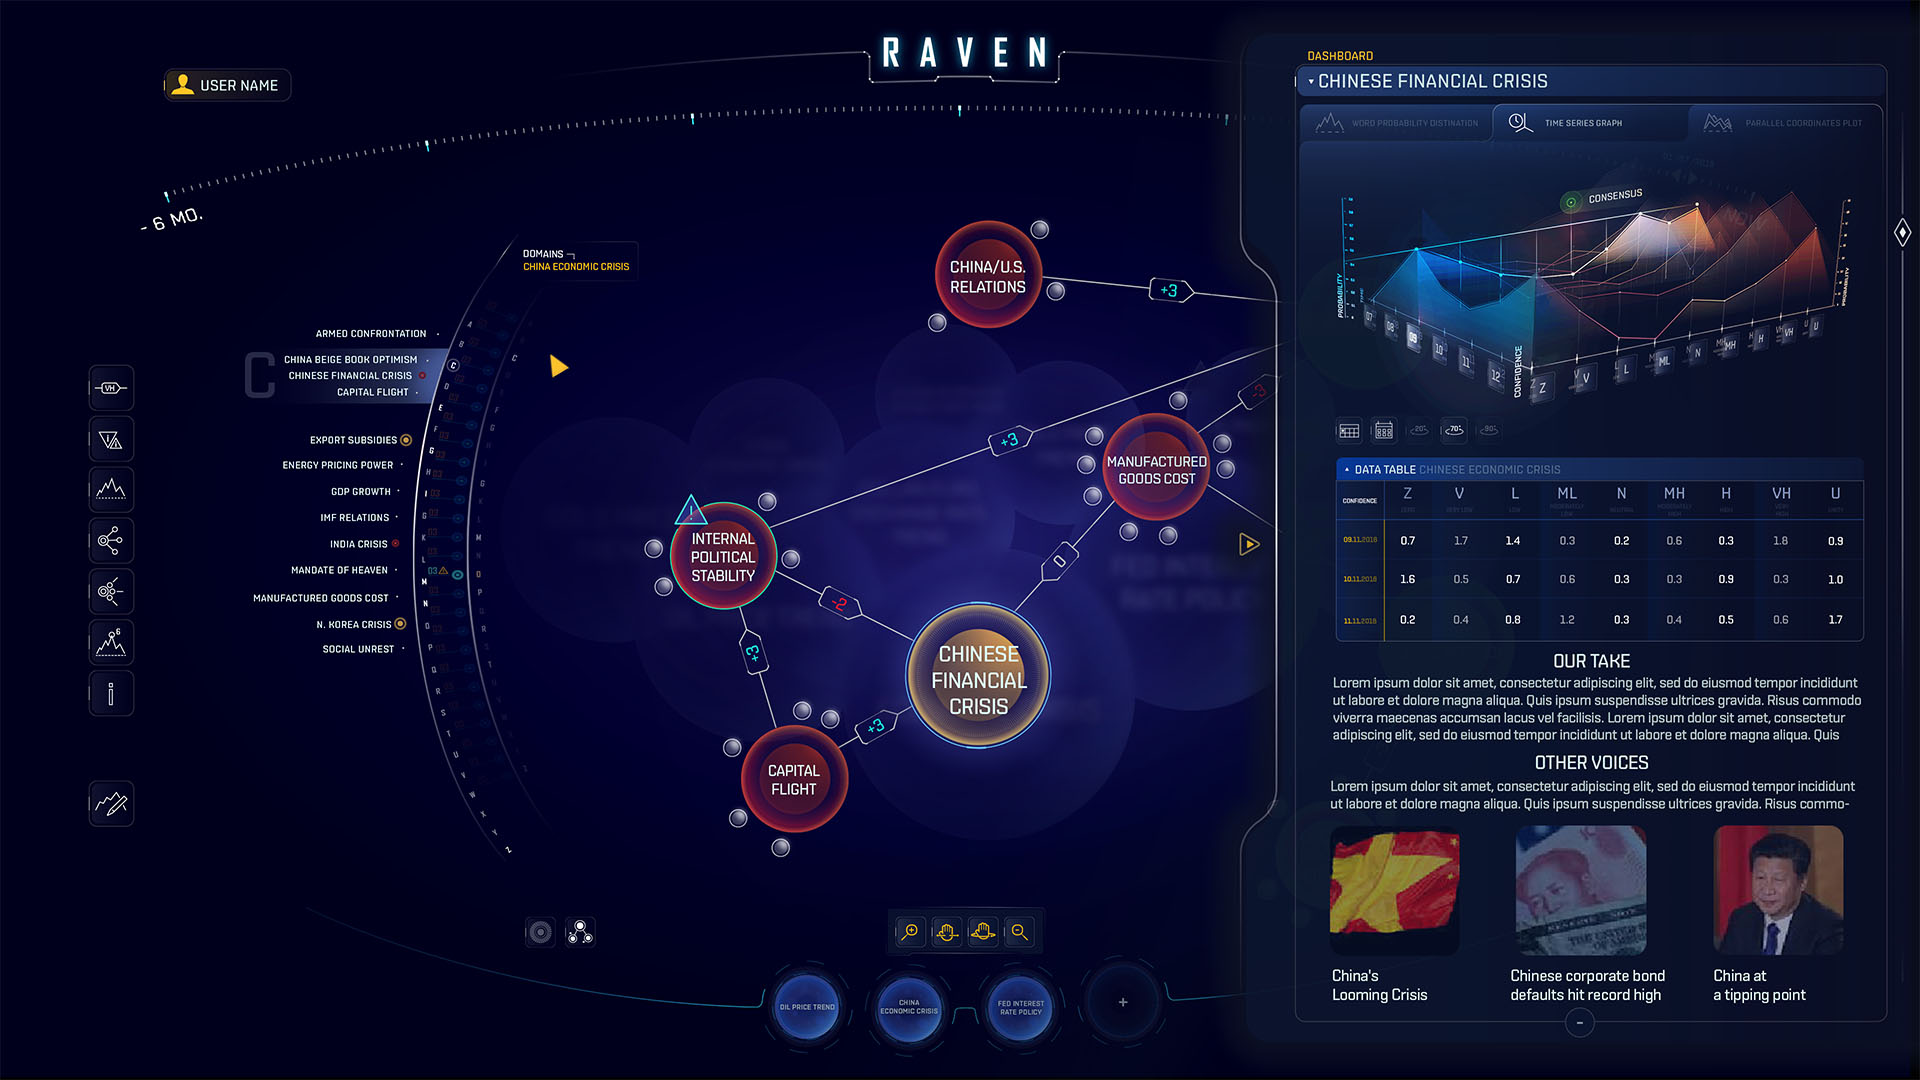
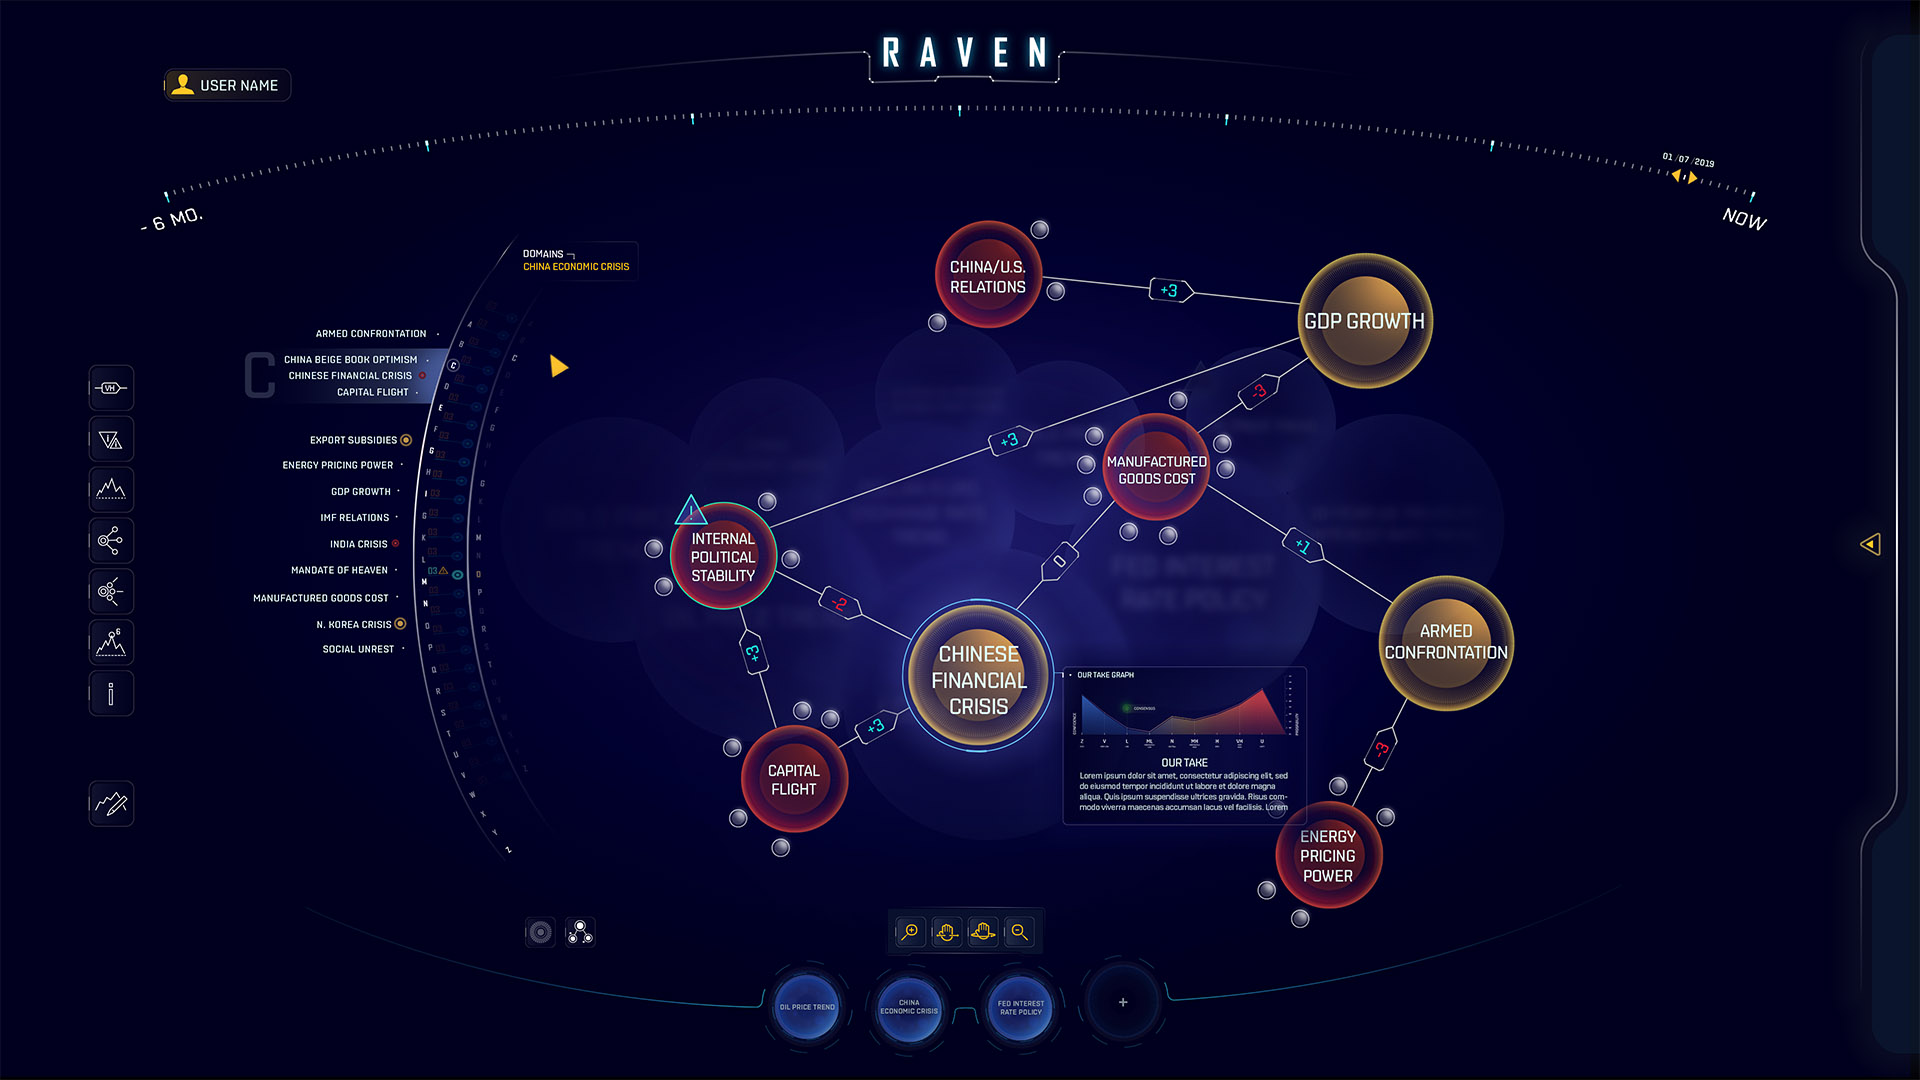
Detailed Graph Display
03
IMPORTANT UX DETAILS
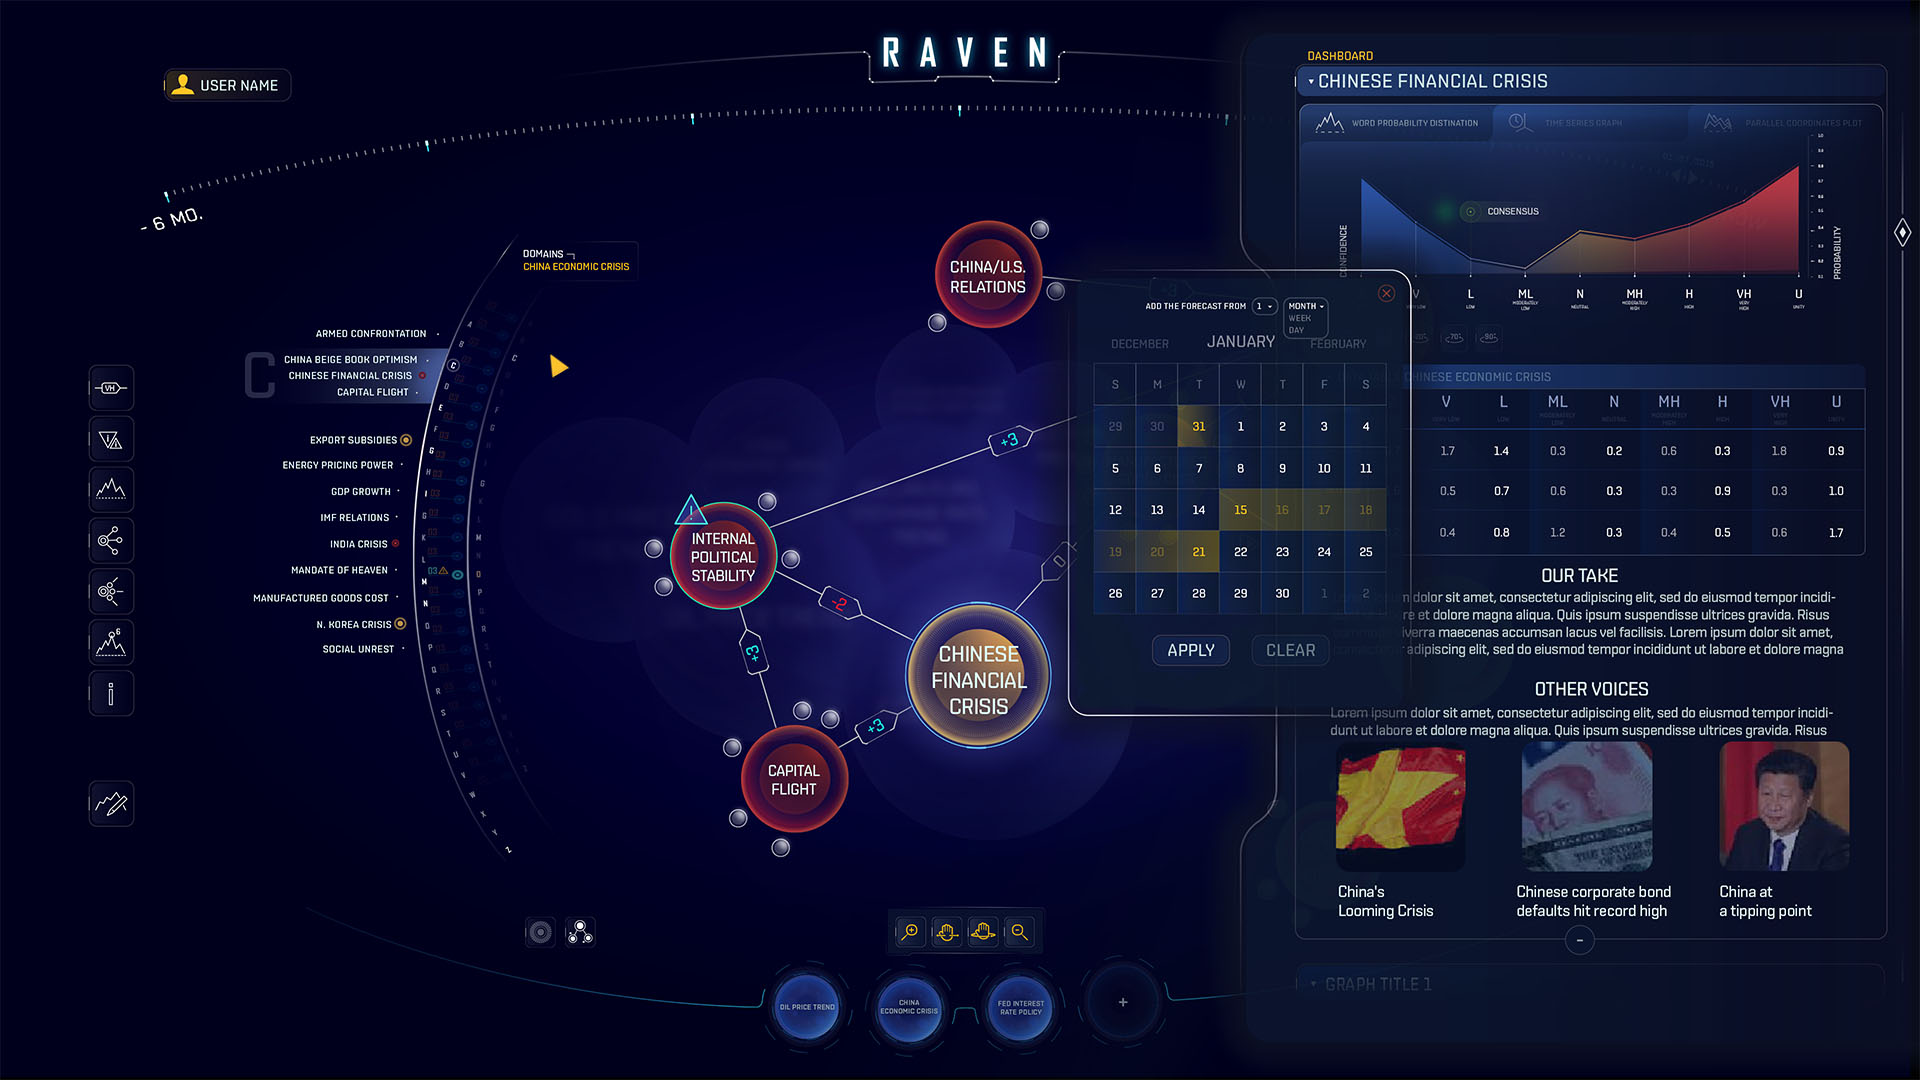
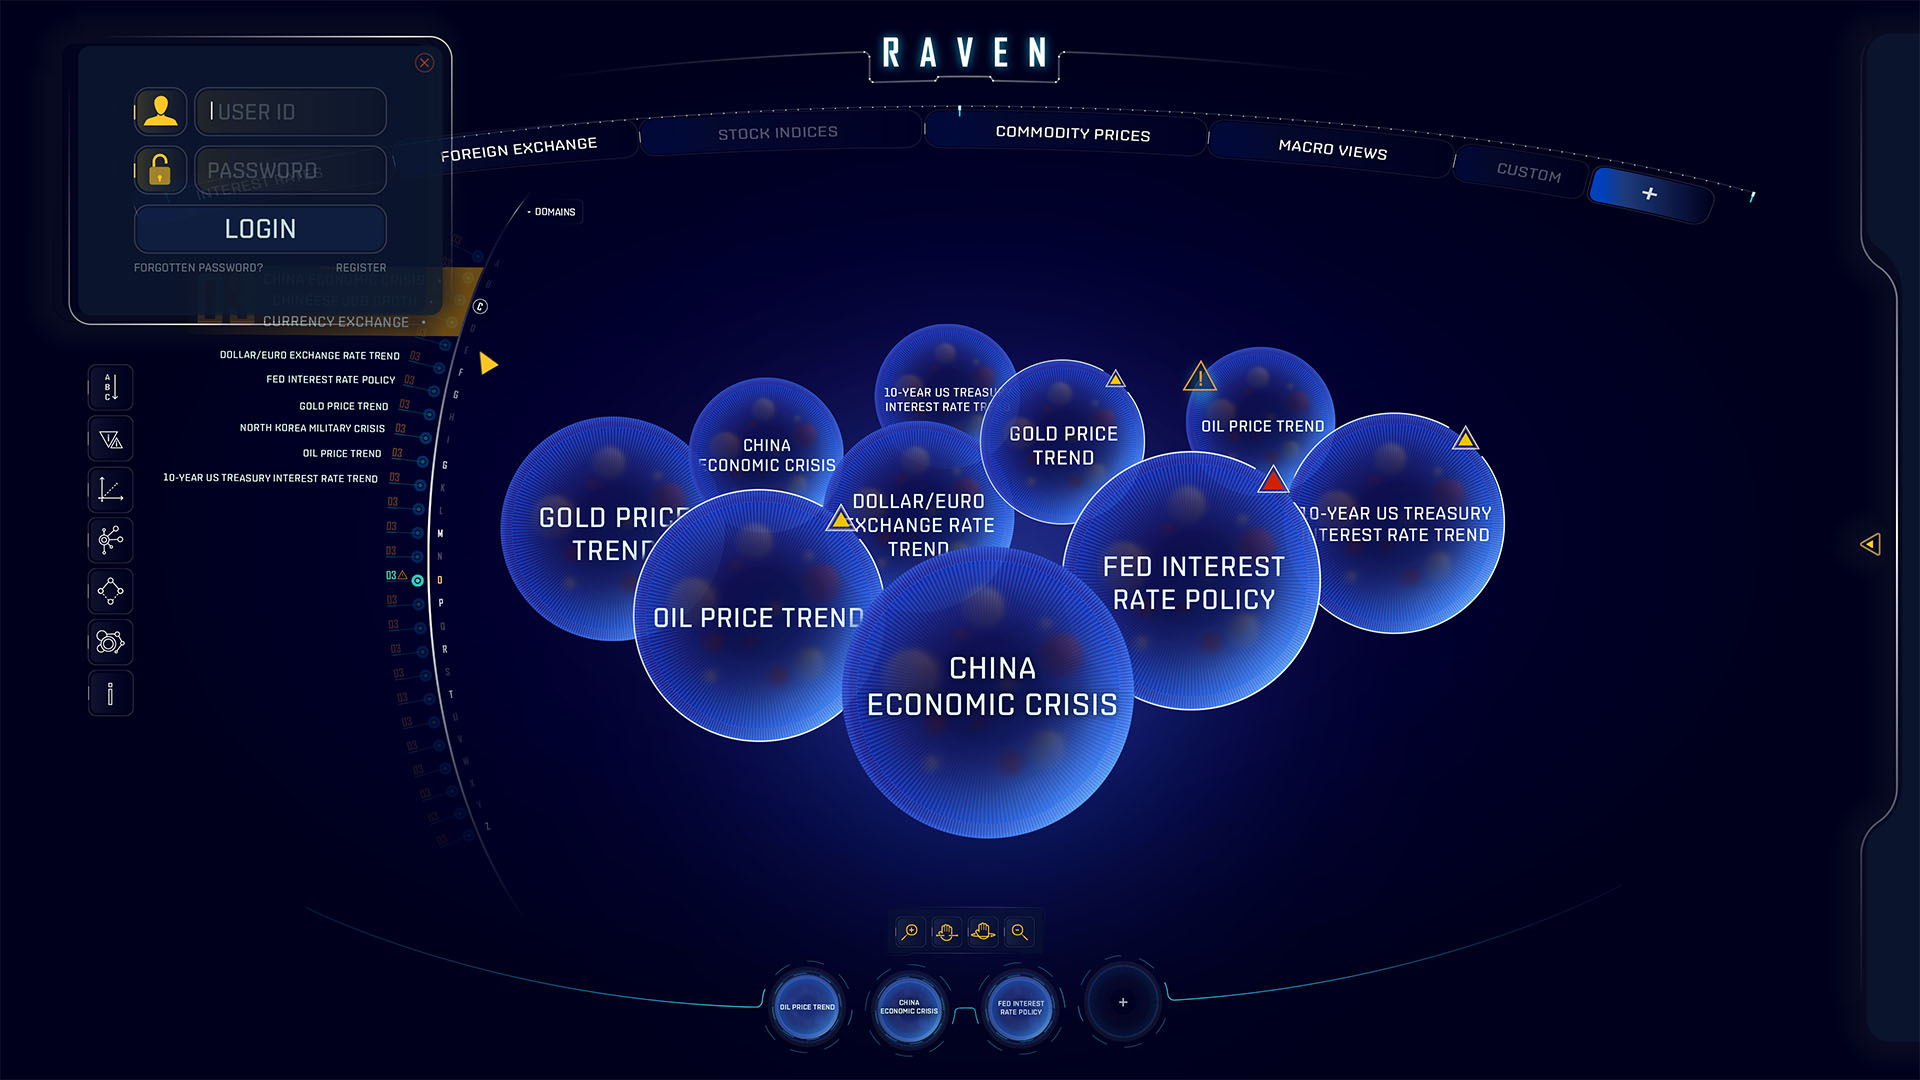
During our time researching with the Meraglim team, we took note of all of the considerations the team had proposed. Such items included data security features, mobile optimization and ongoing, live IT services. Each of these considerations became a driving force in our designs, ensuring that the user experience of Raven was at maximum performance.
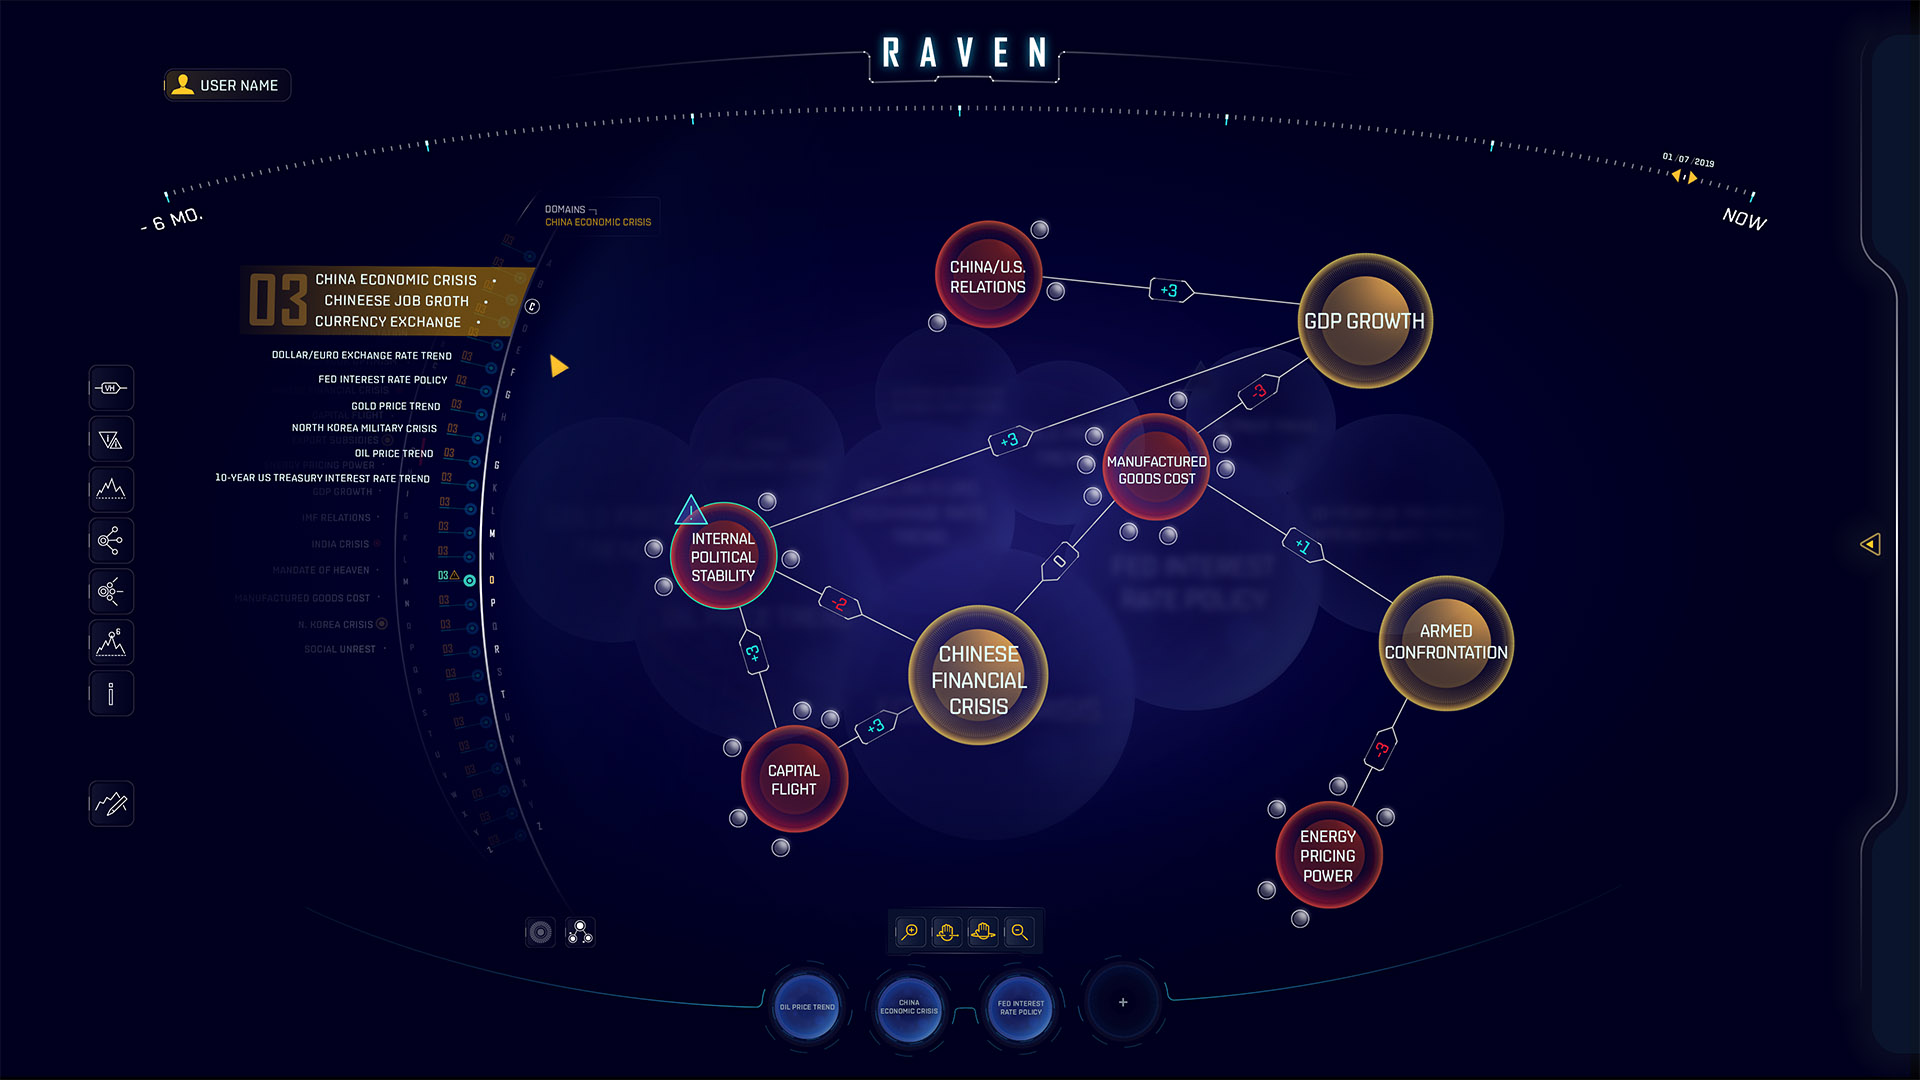
Expanded Side Bar Information
04
CONSIDERING CONSTRAINTS
After our research was complete, we partnered with Meraglim’s technical resources to understand the current system architecture and core analytics engine. This provided us with the necessary details to inform any constraints or considerations to be taken into account during development.
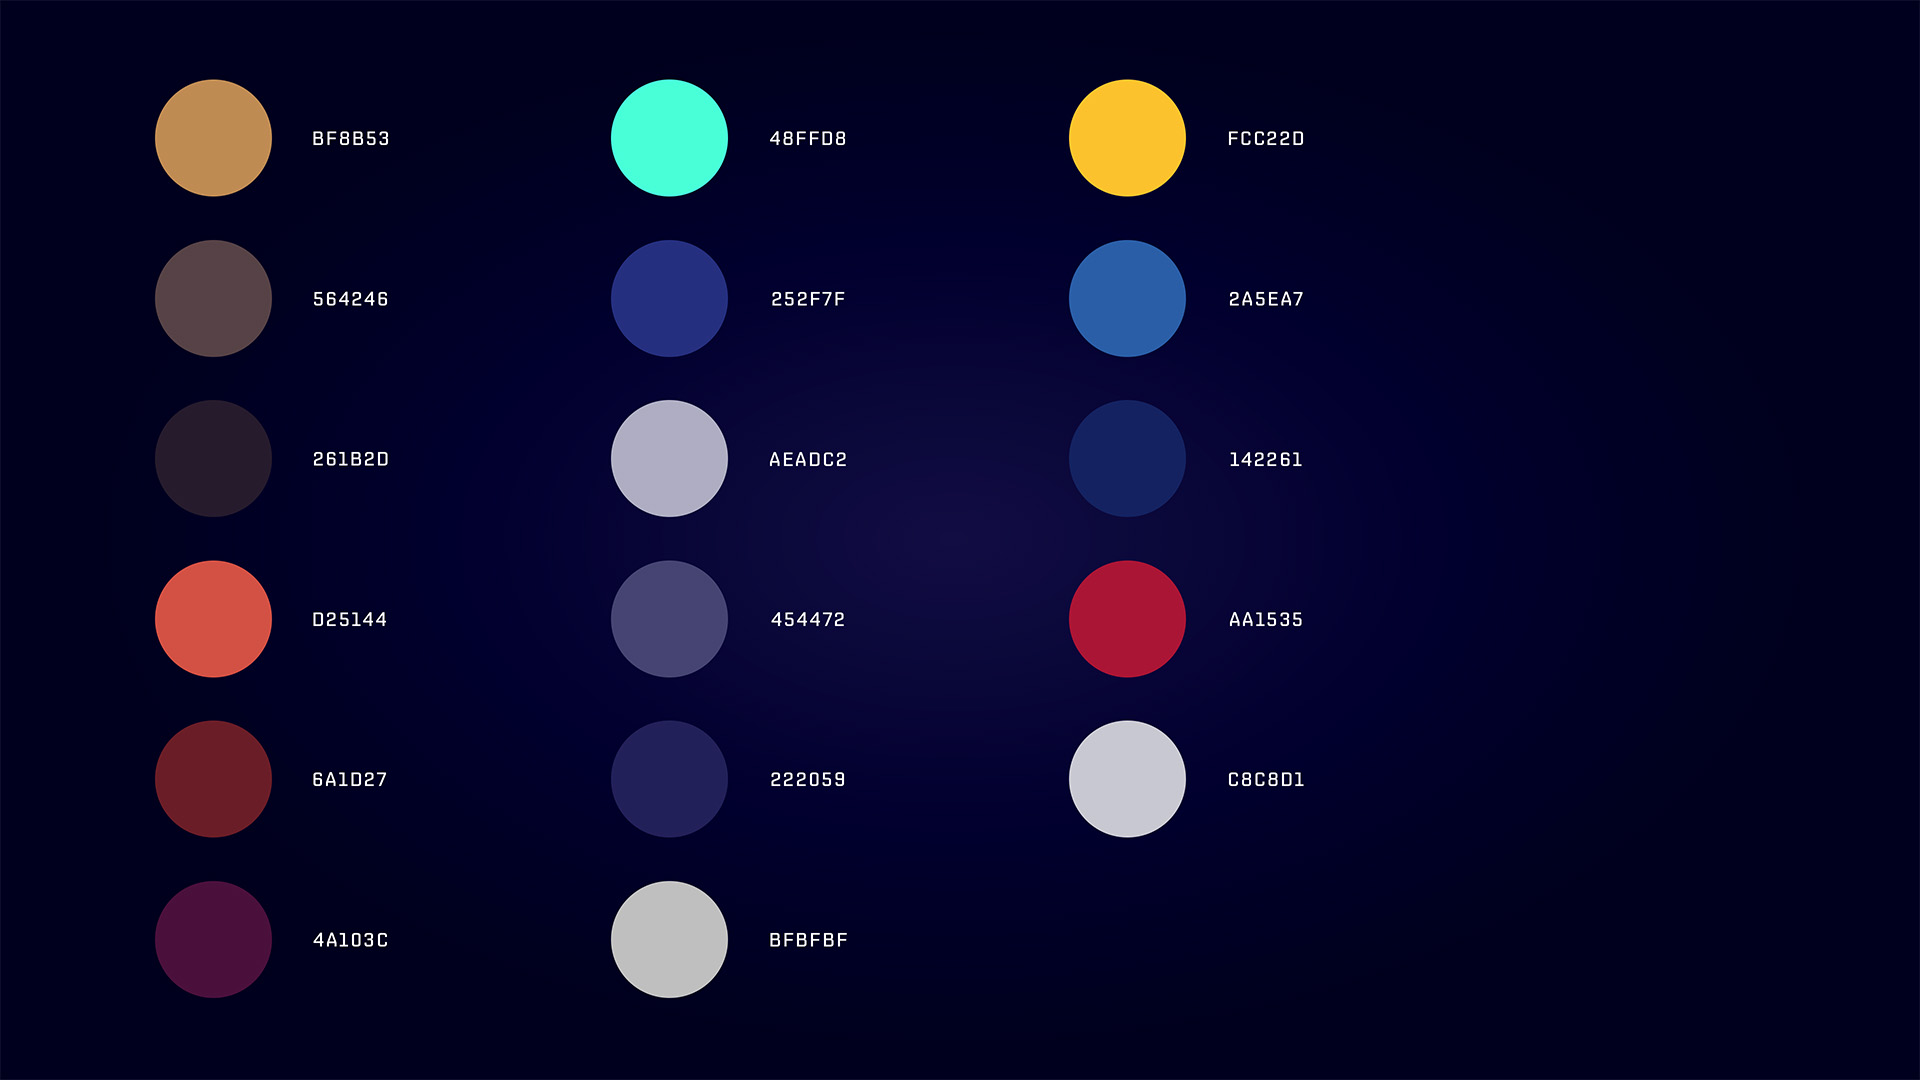
Look Development
05
UX ANALYSIS
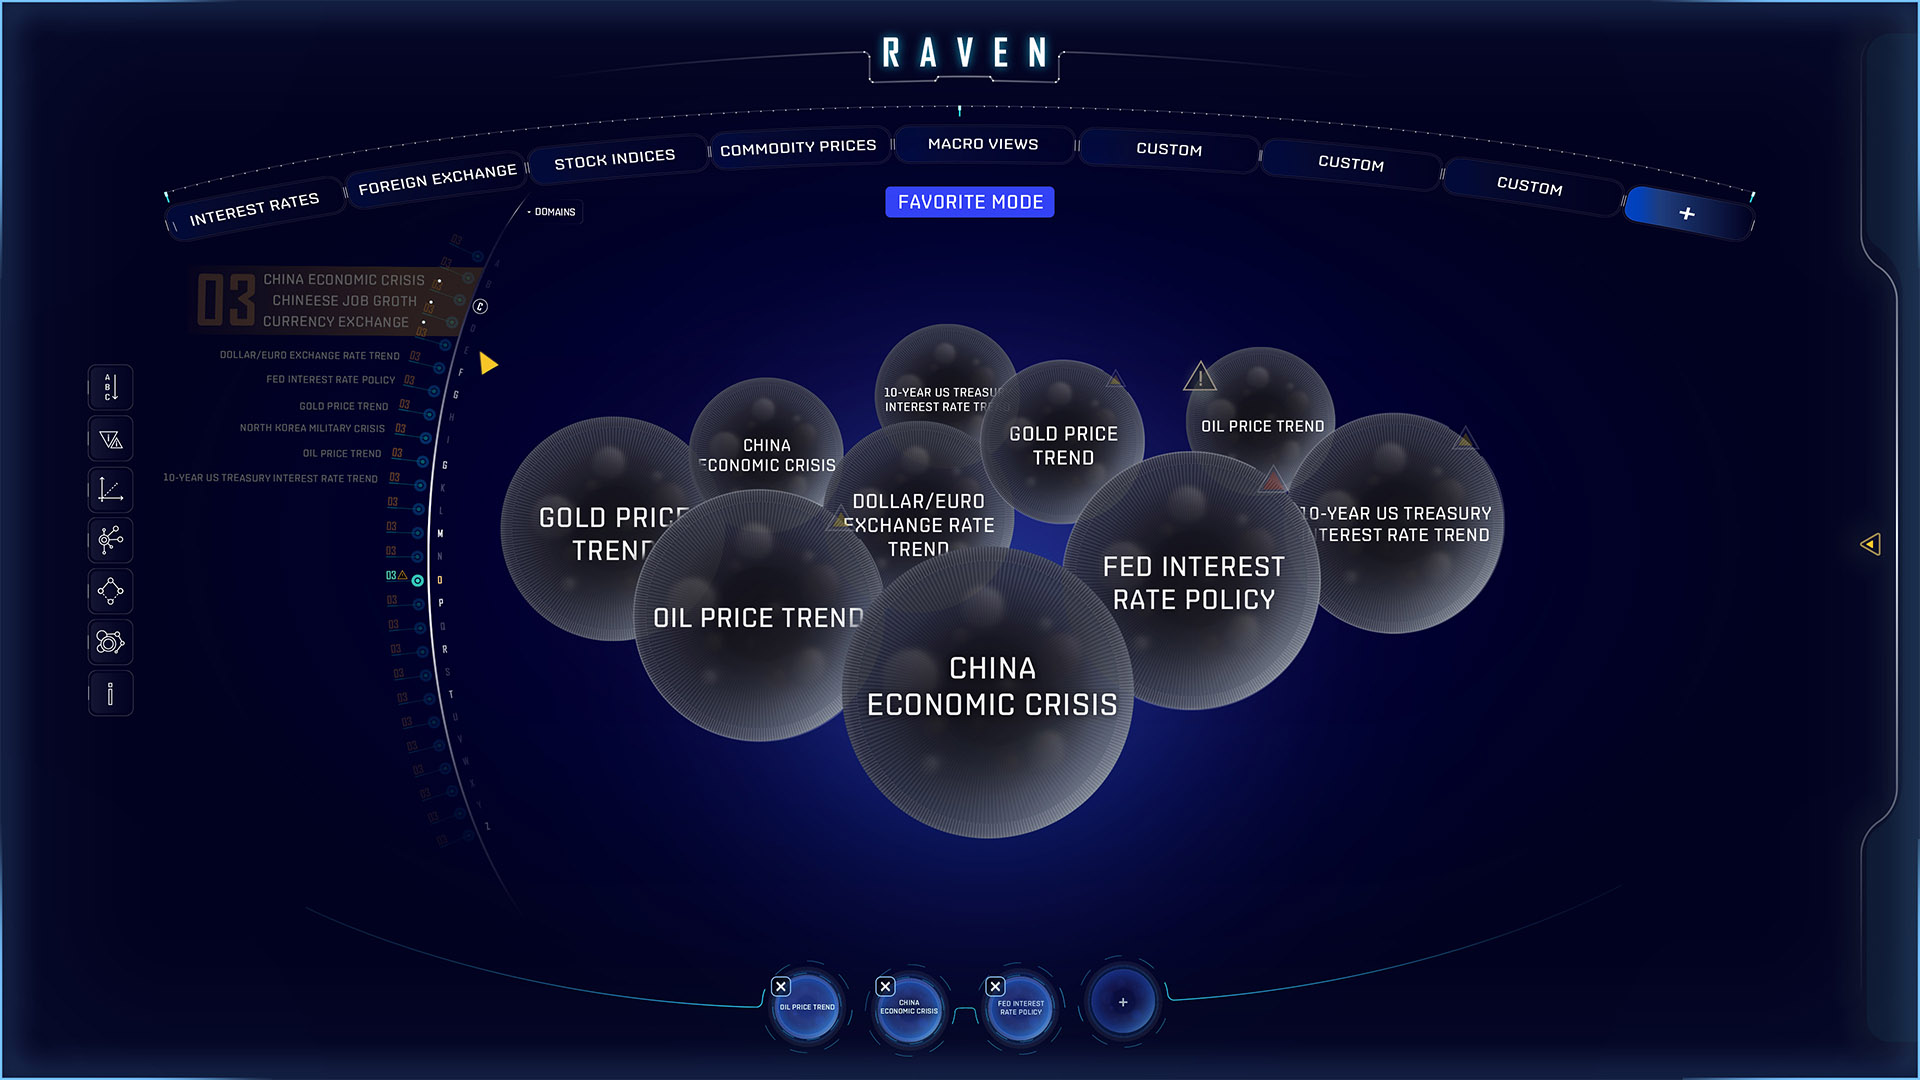
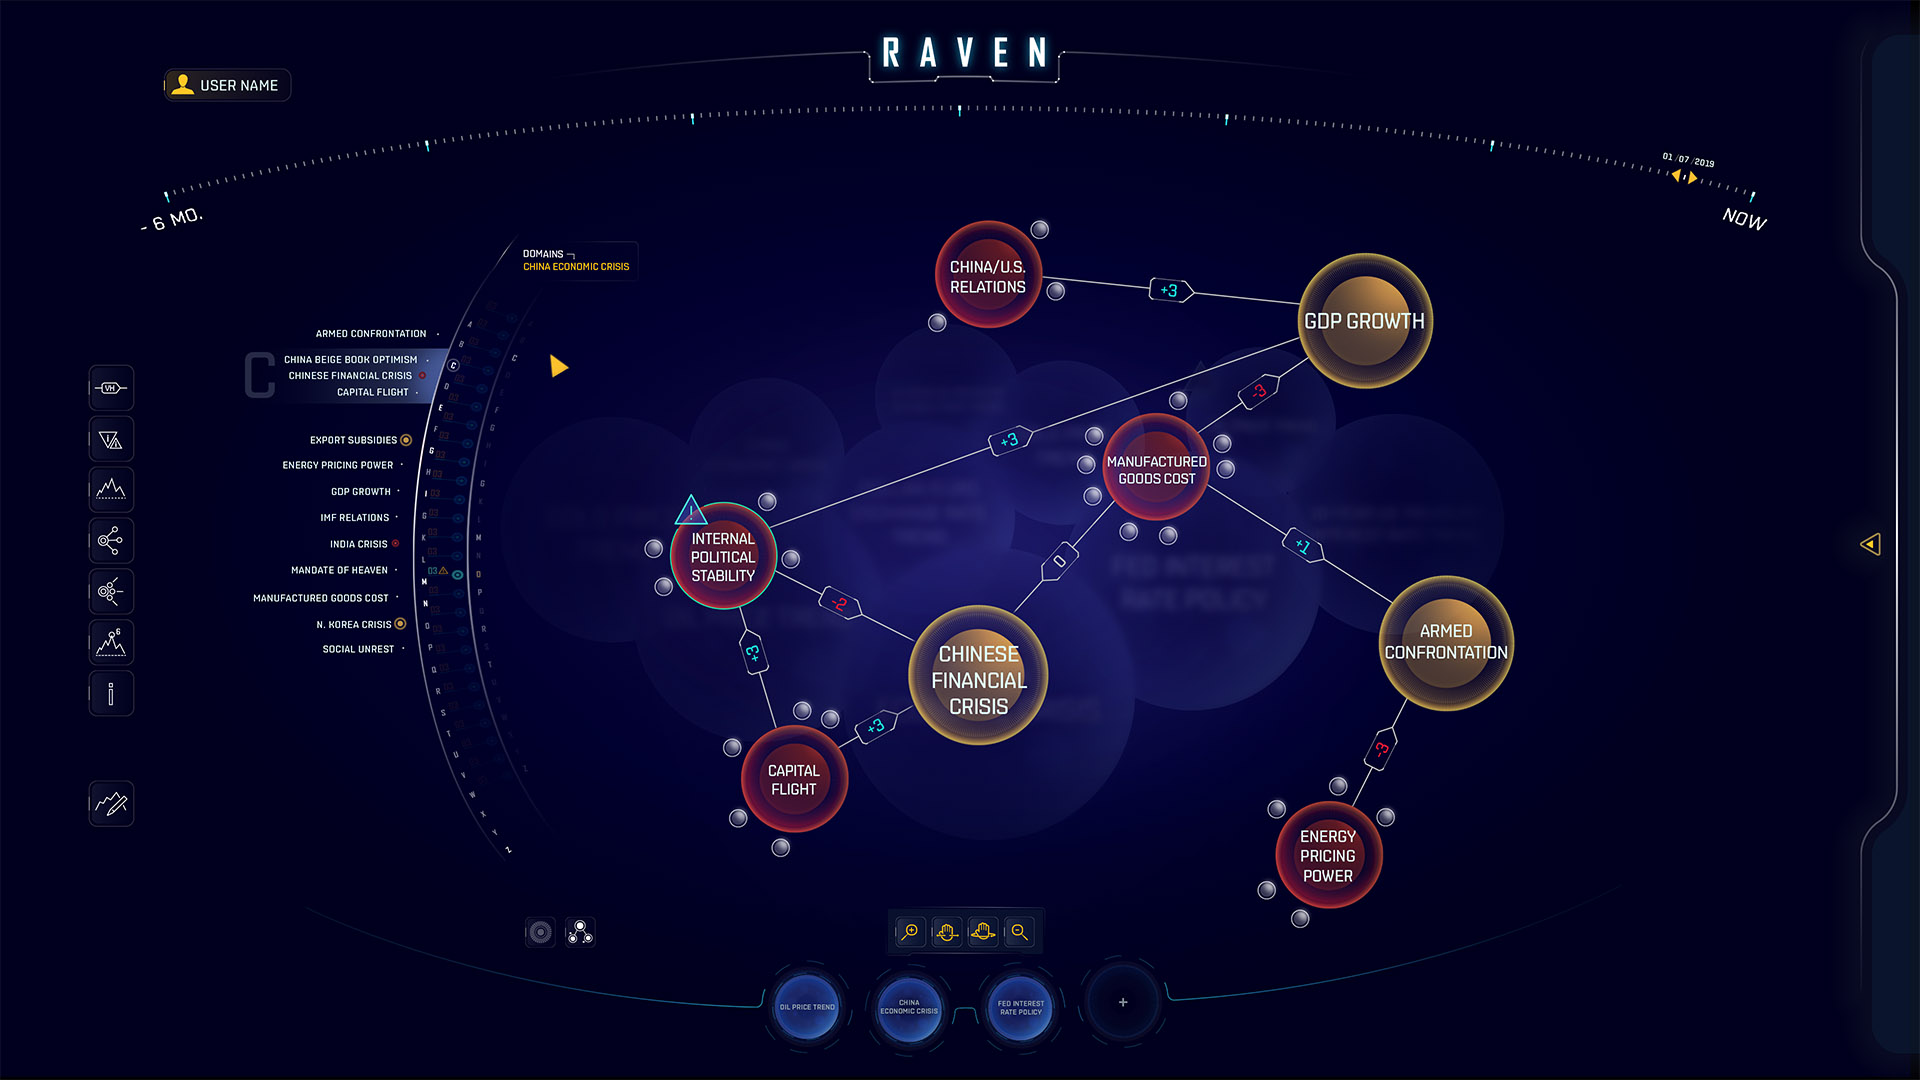
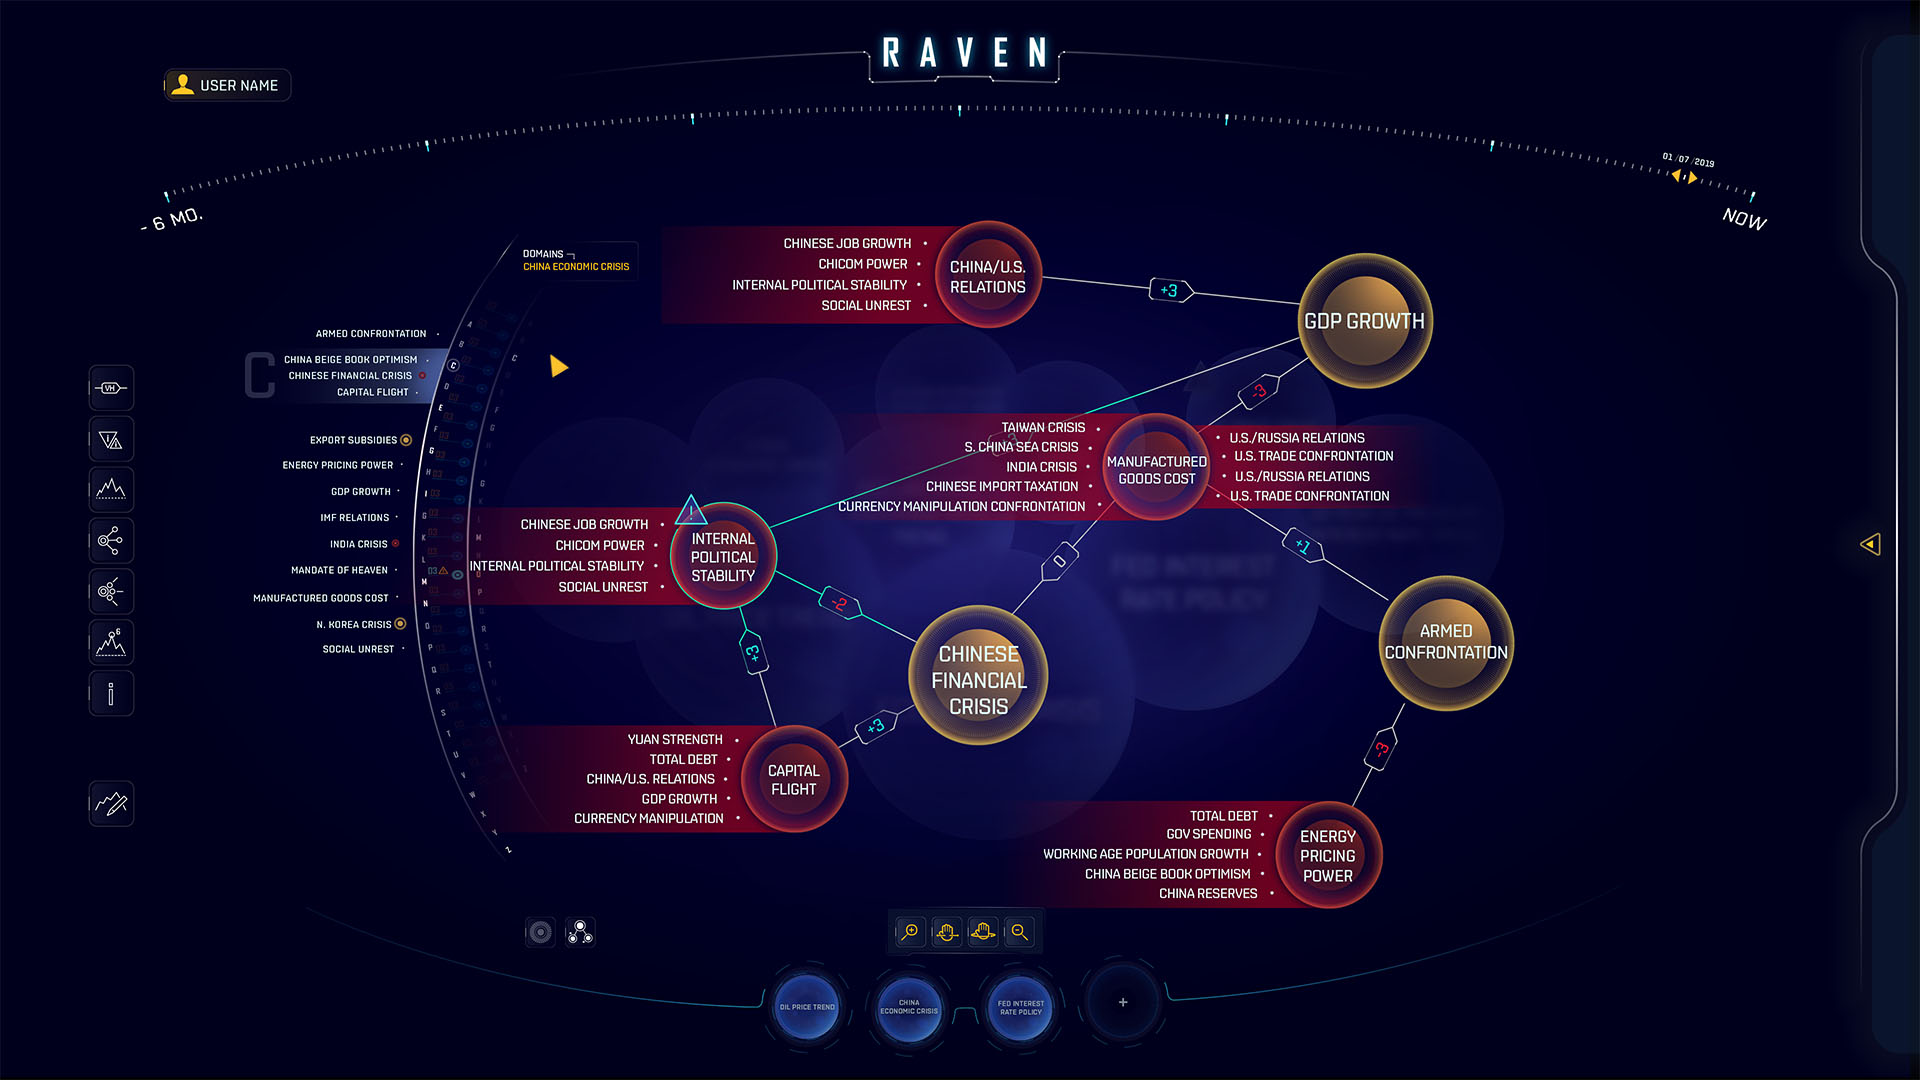
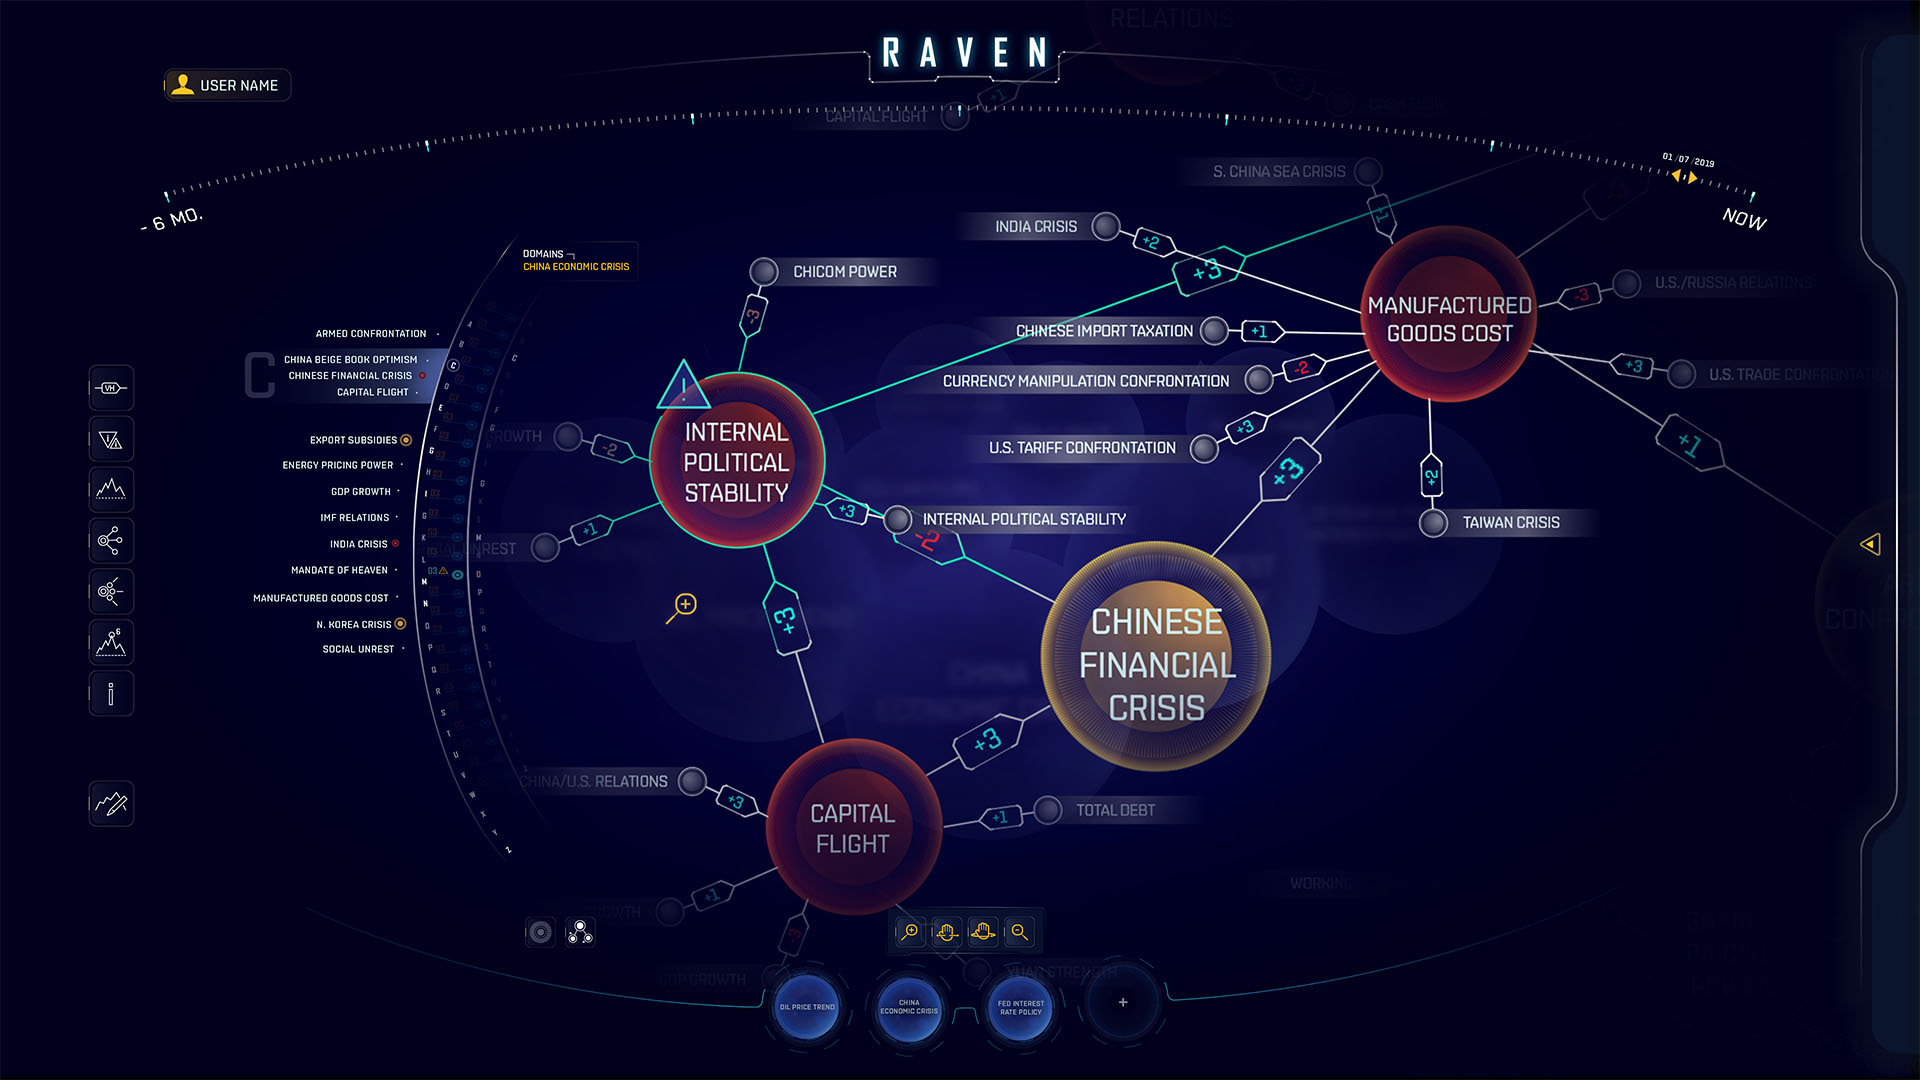
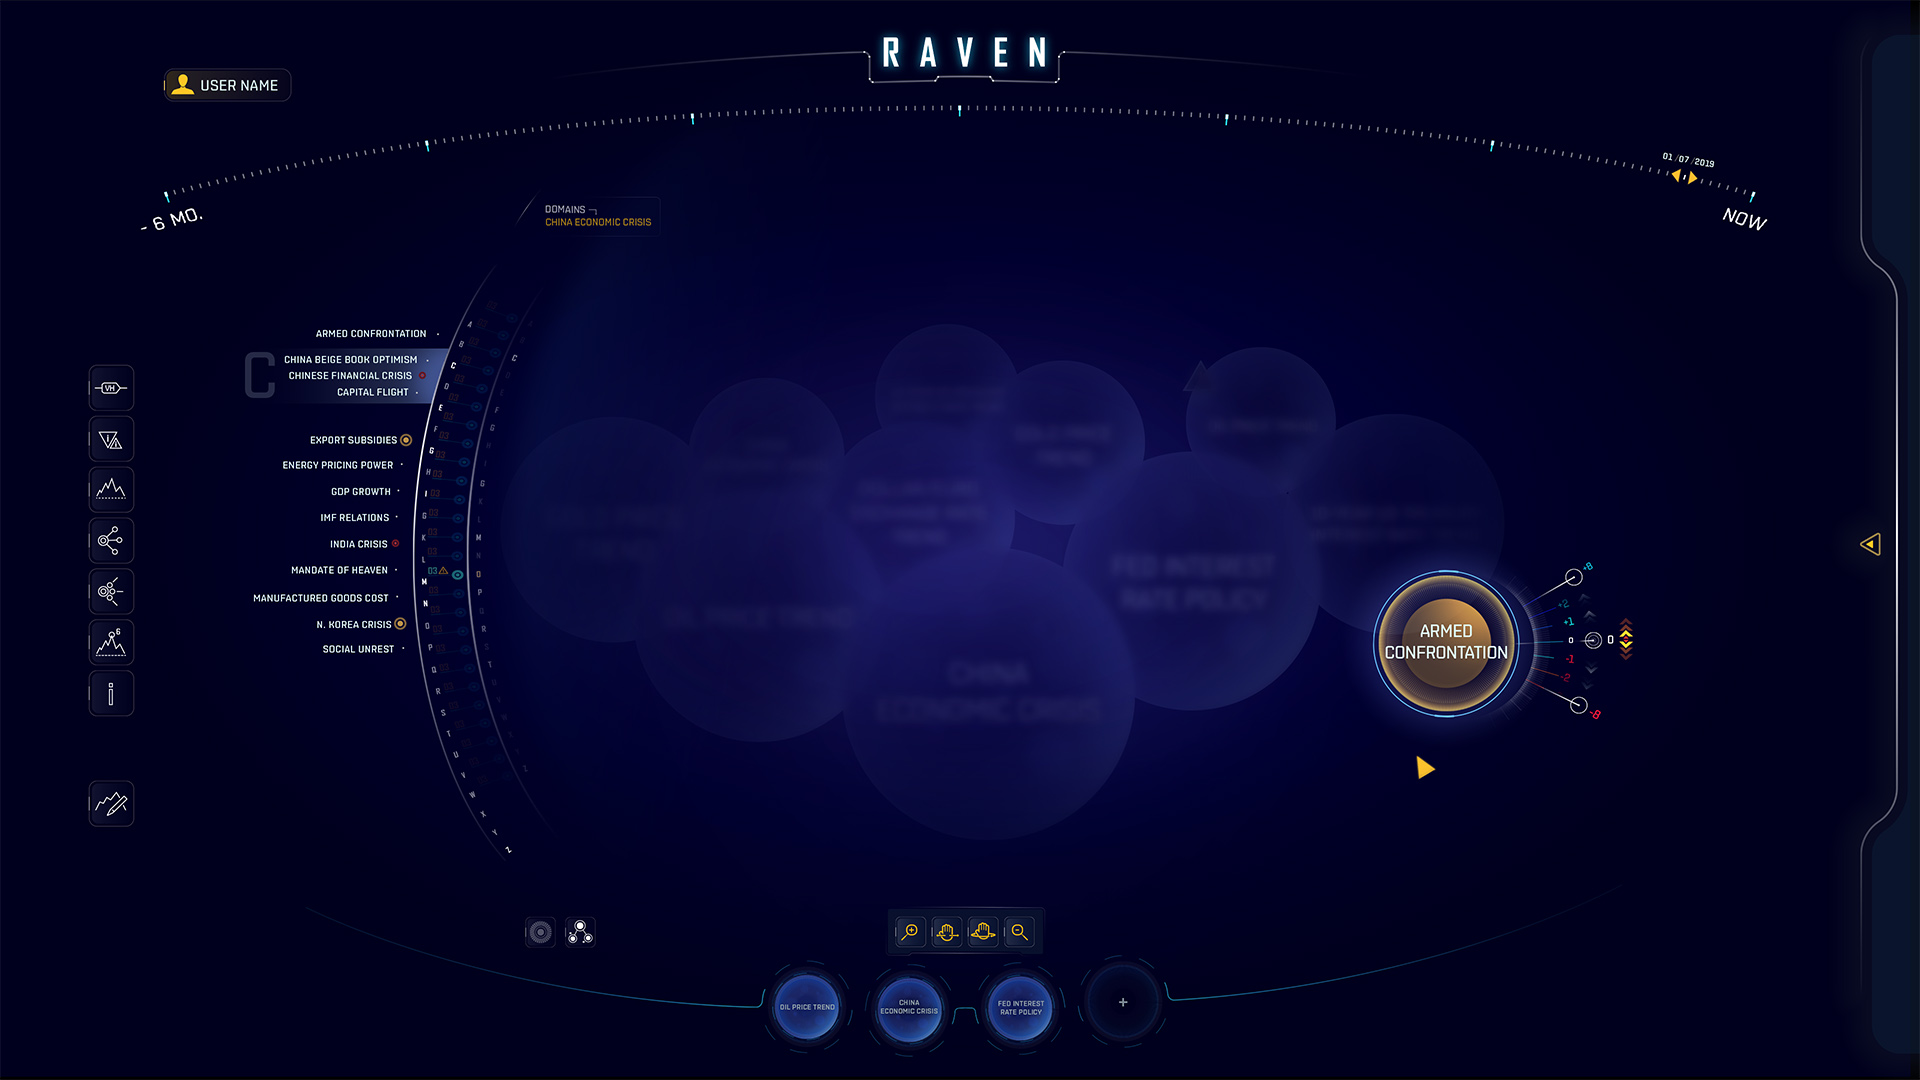
As we began constructing concepts based on our research, restraints and considerations, we found that a node-based interface was the most efficient at conveying all necessary information within Raven’s platform. We examined existing node-based interfaces and aligned key features with Meraglim. Since the financial results within Raven are so dependent on information input and world events, we considered the nodes to be a highly controllable and interactive environment where the user could navigate freely and gather real time information quickly.
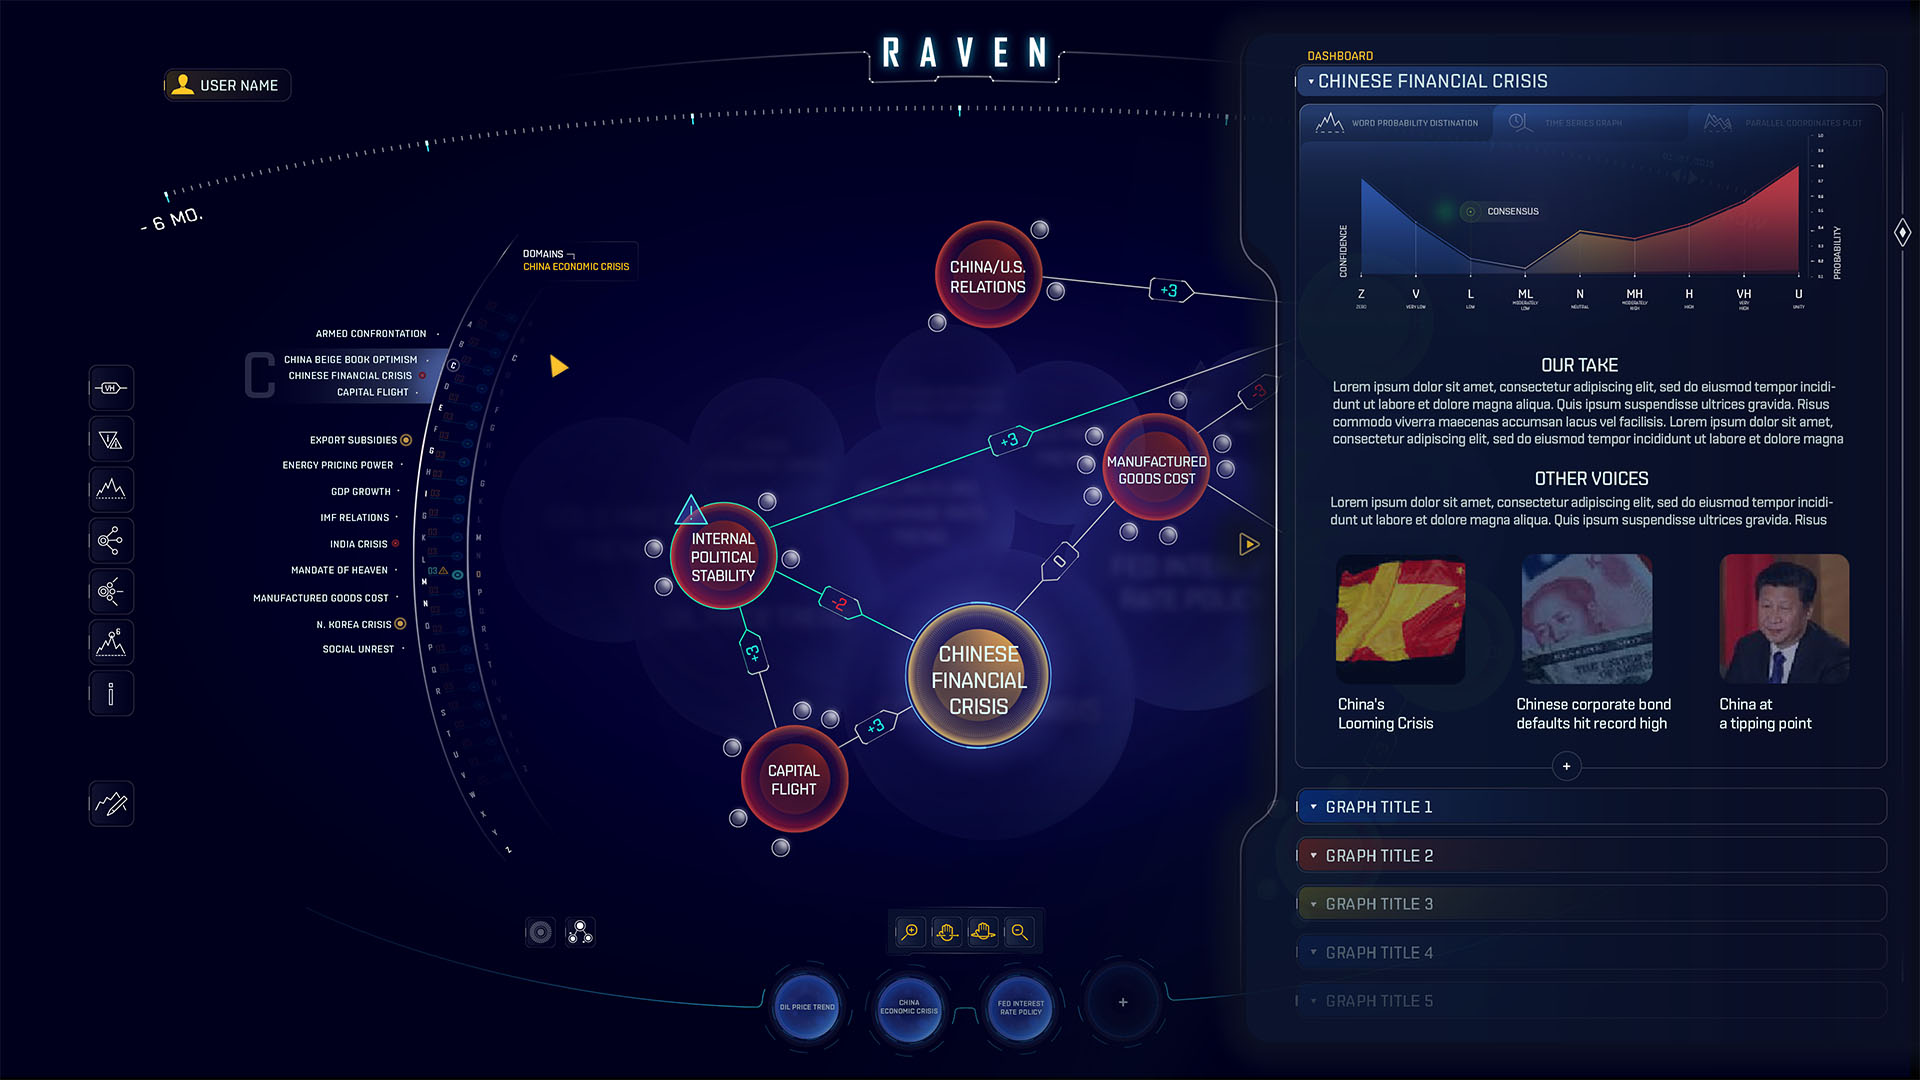
Node Tree Layout
06
KEY FEATURES
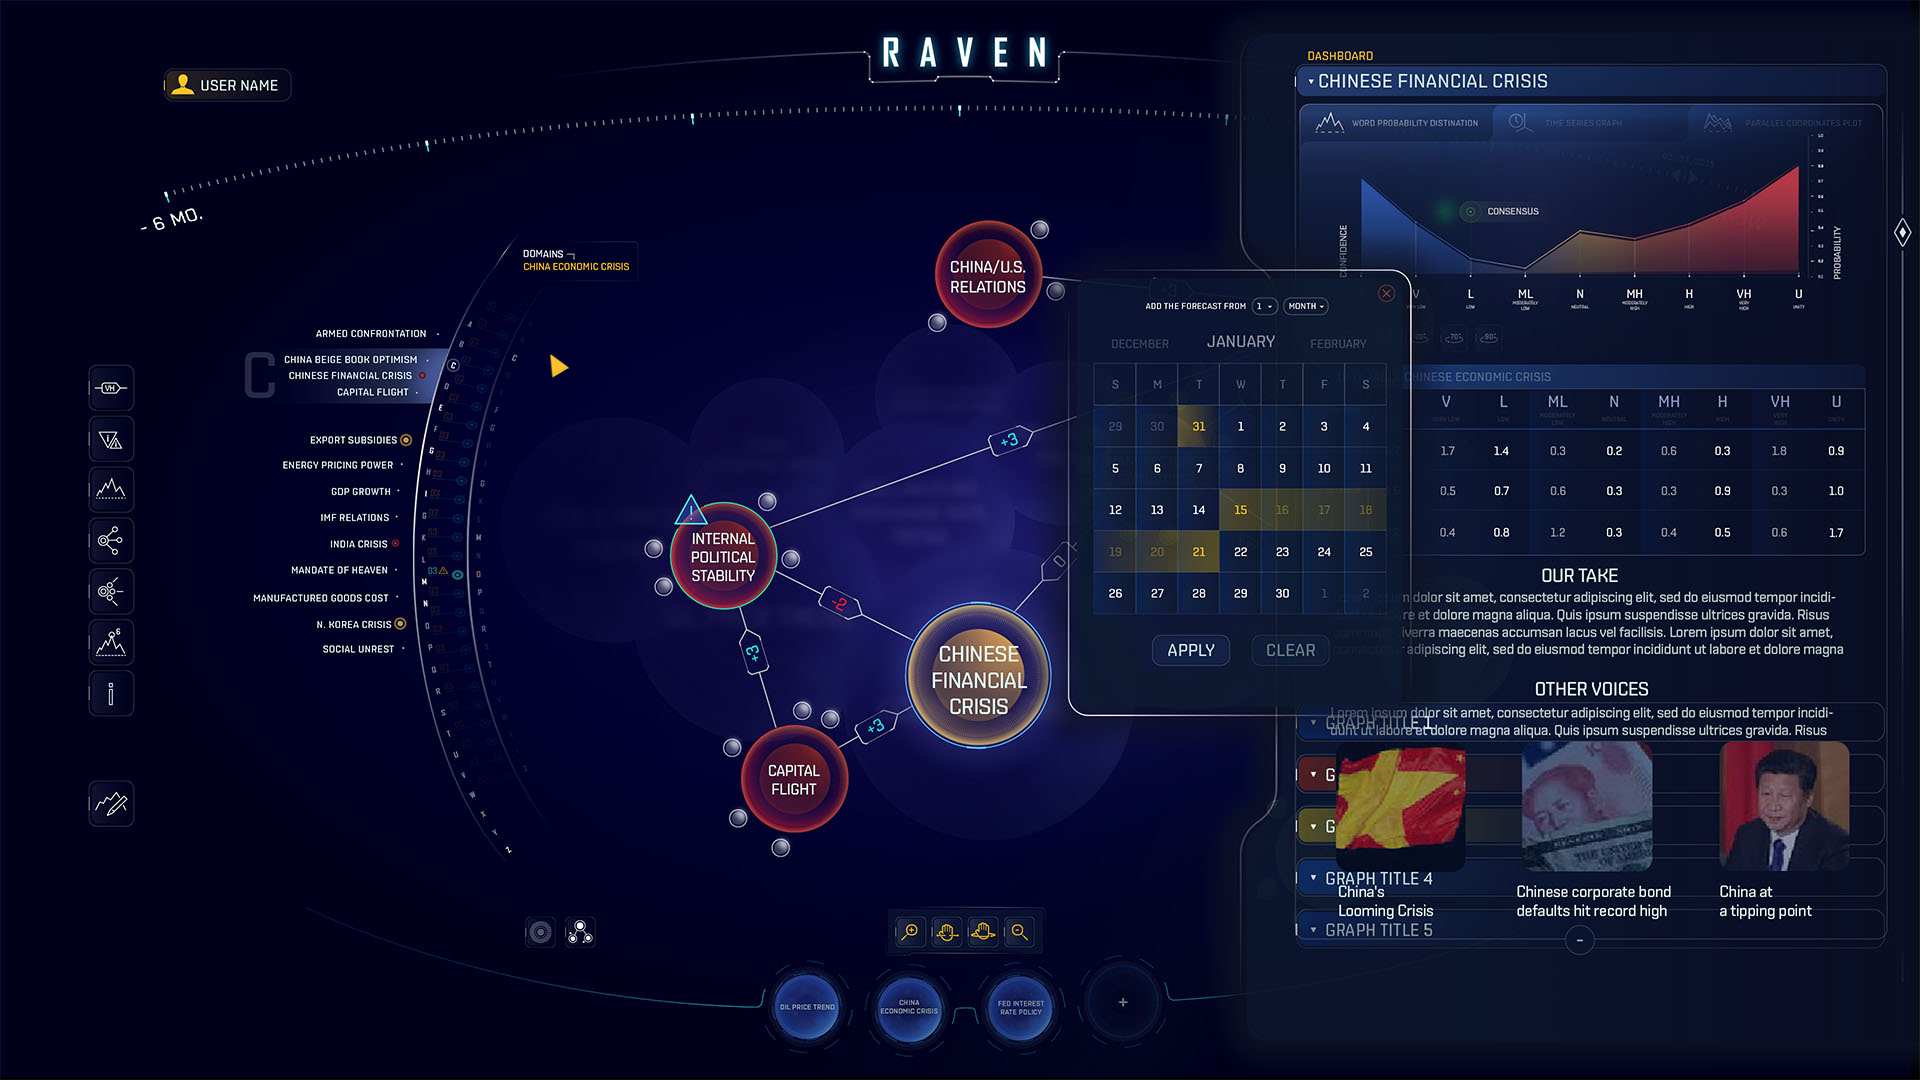
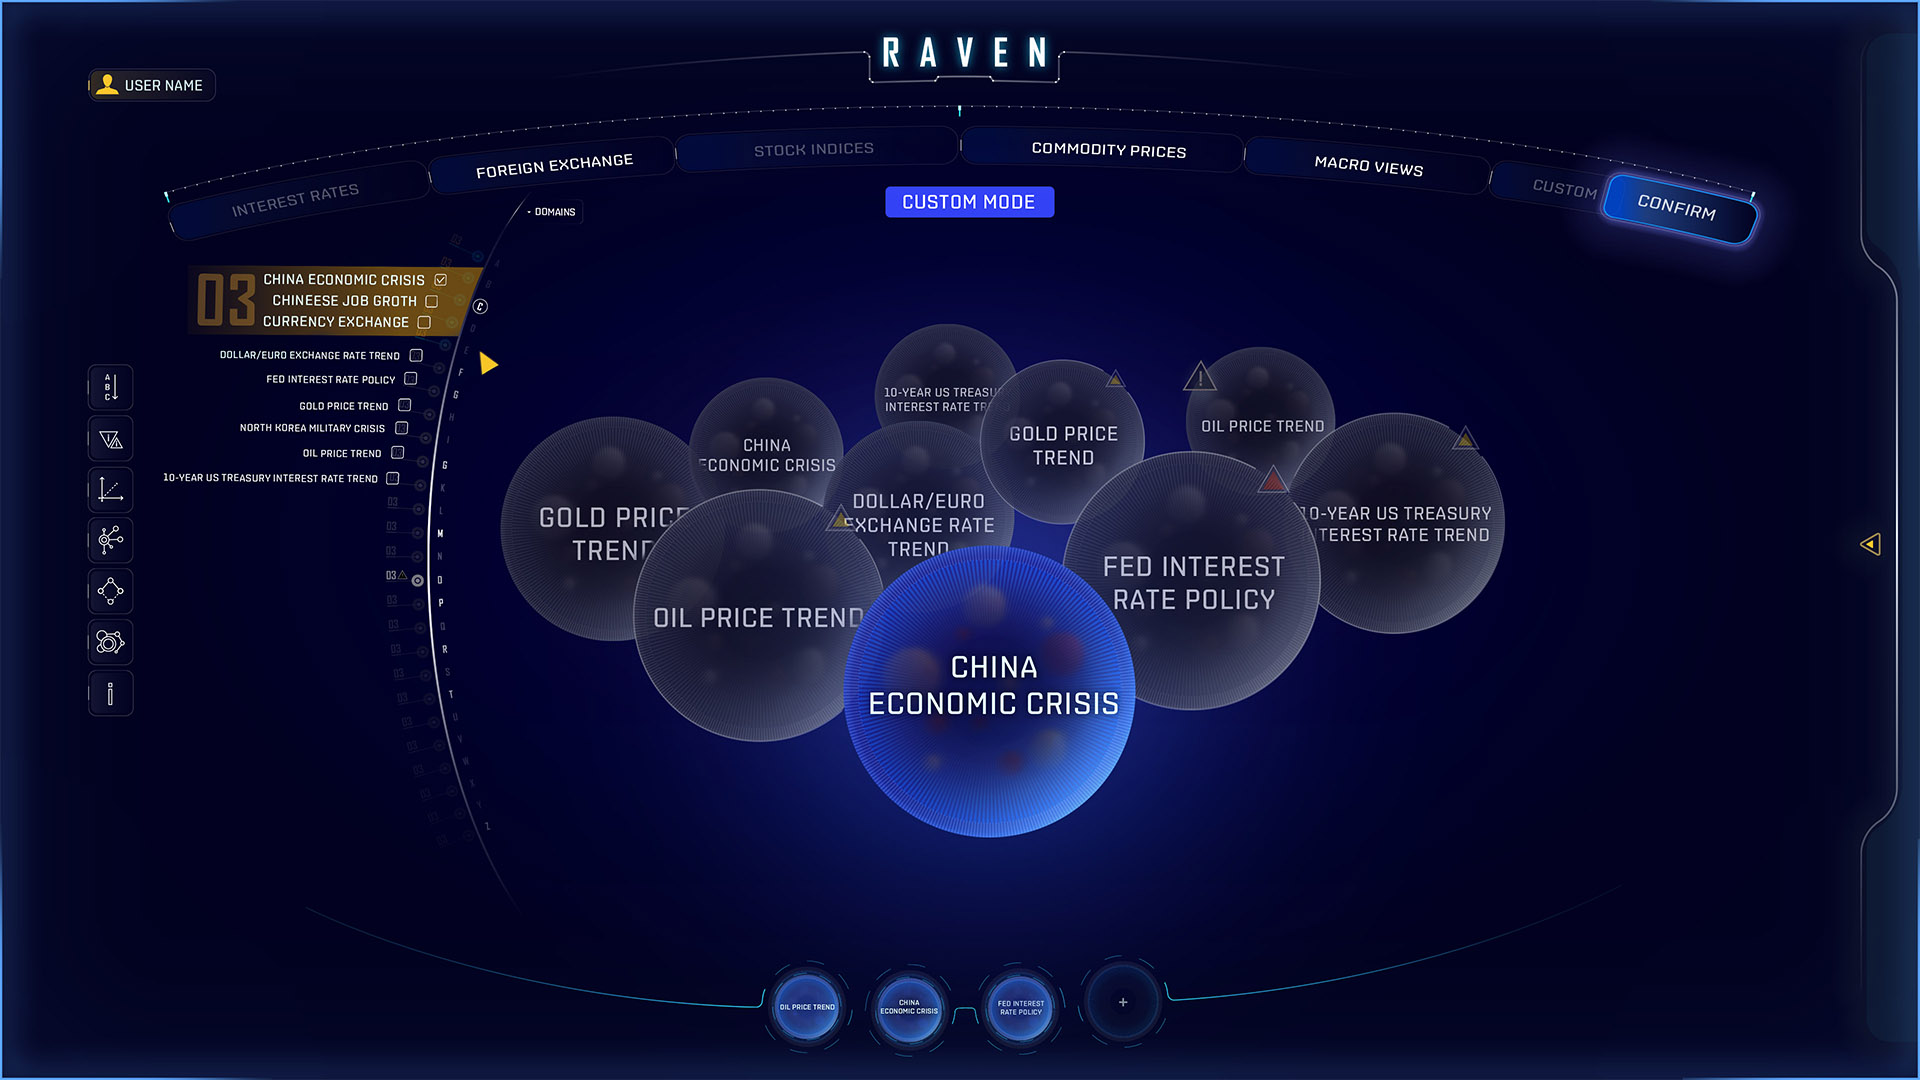
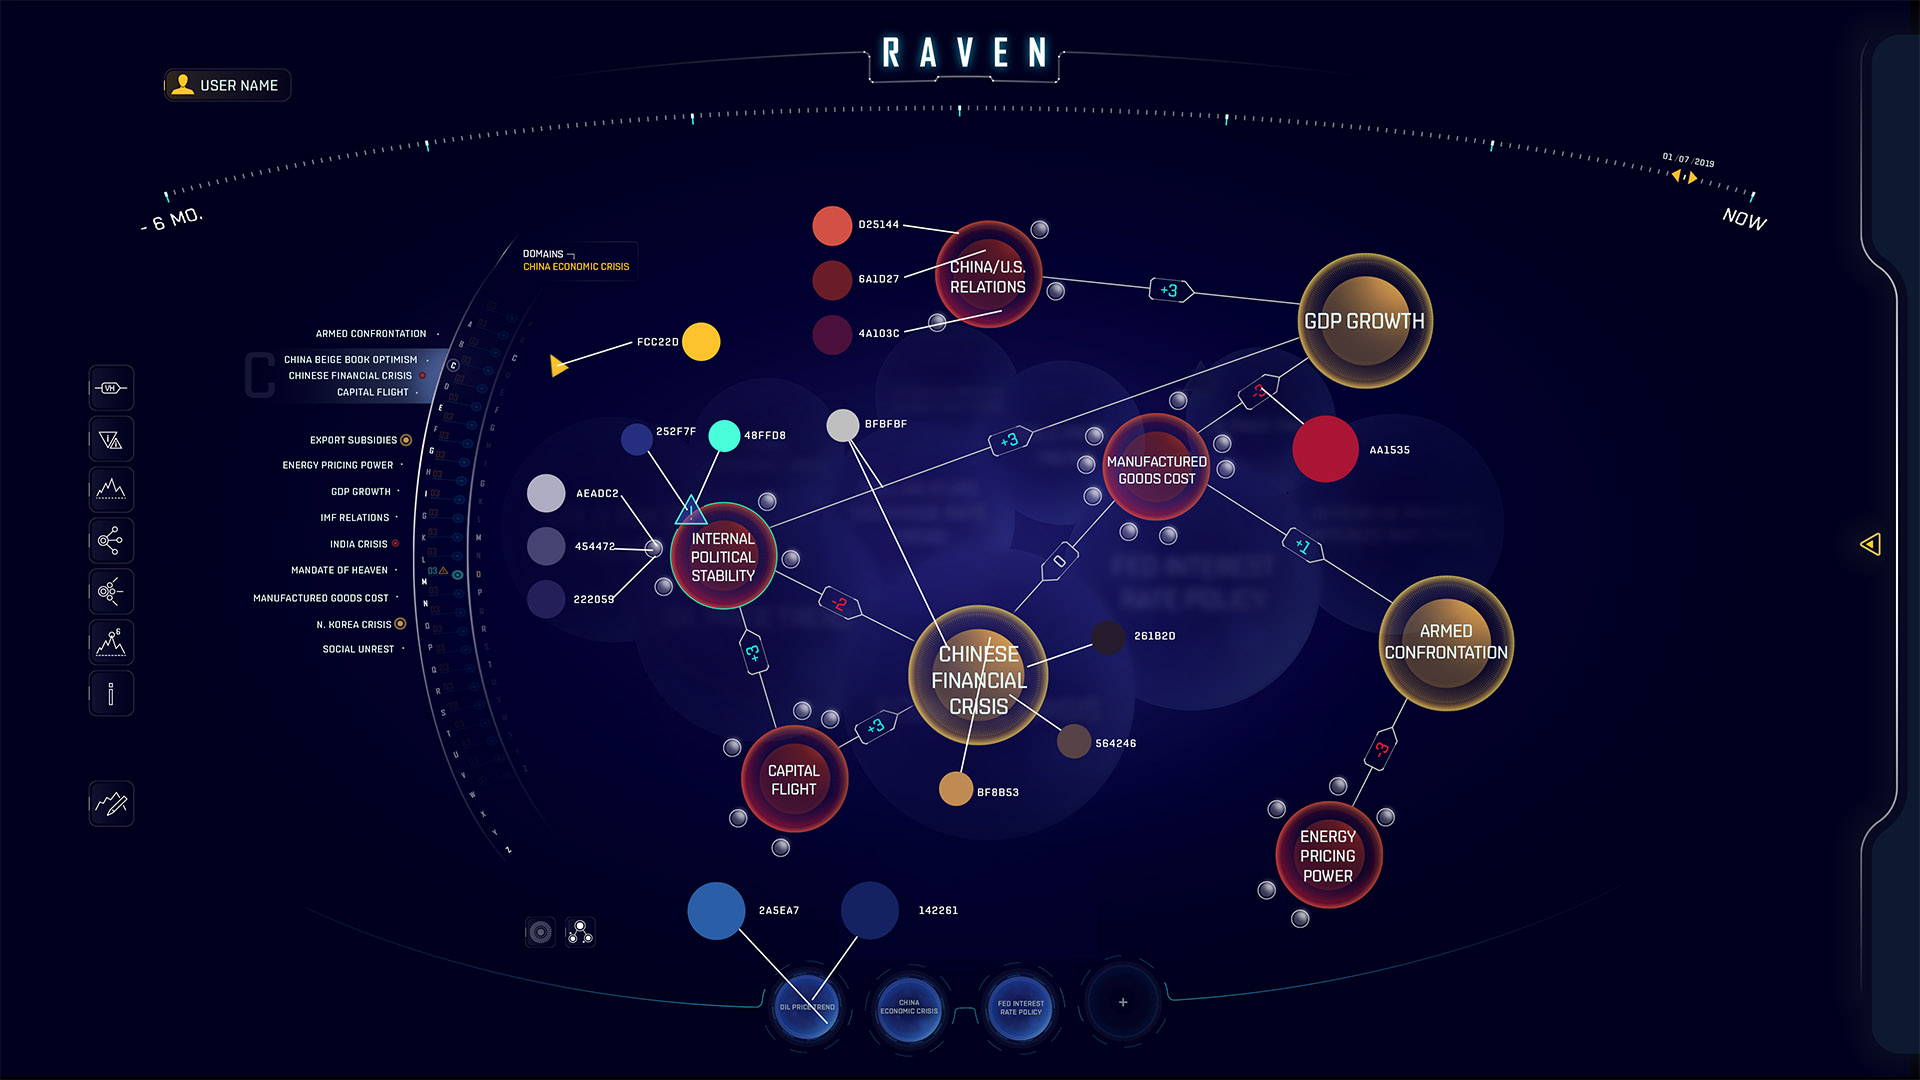
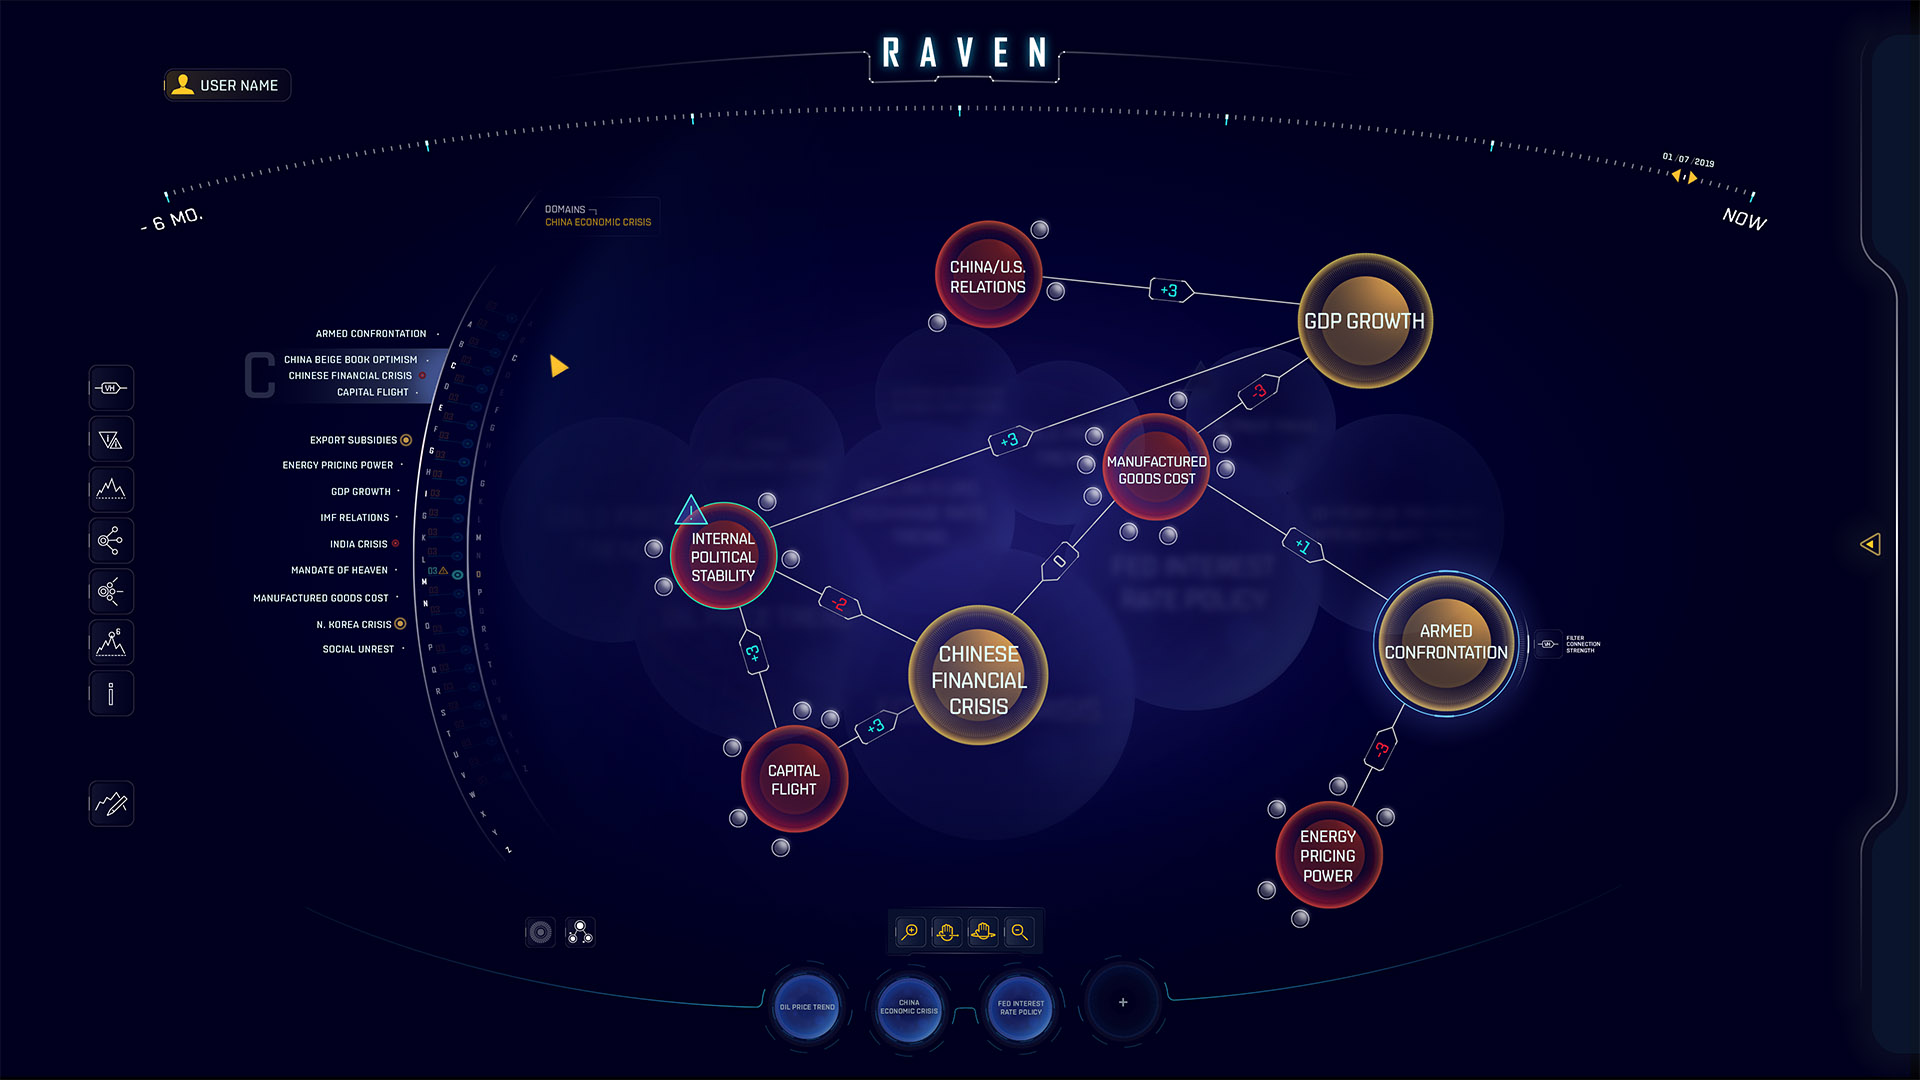
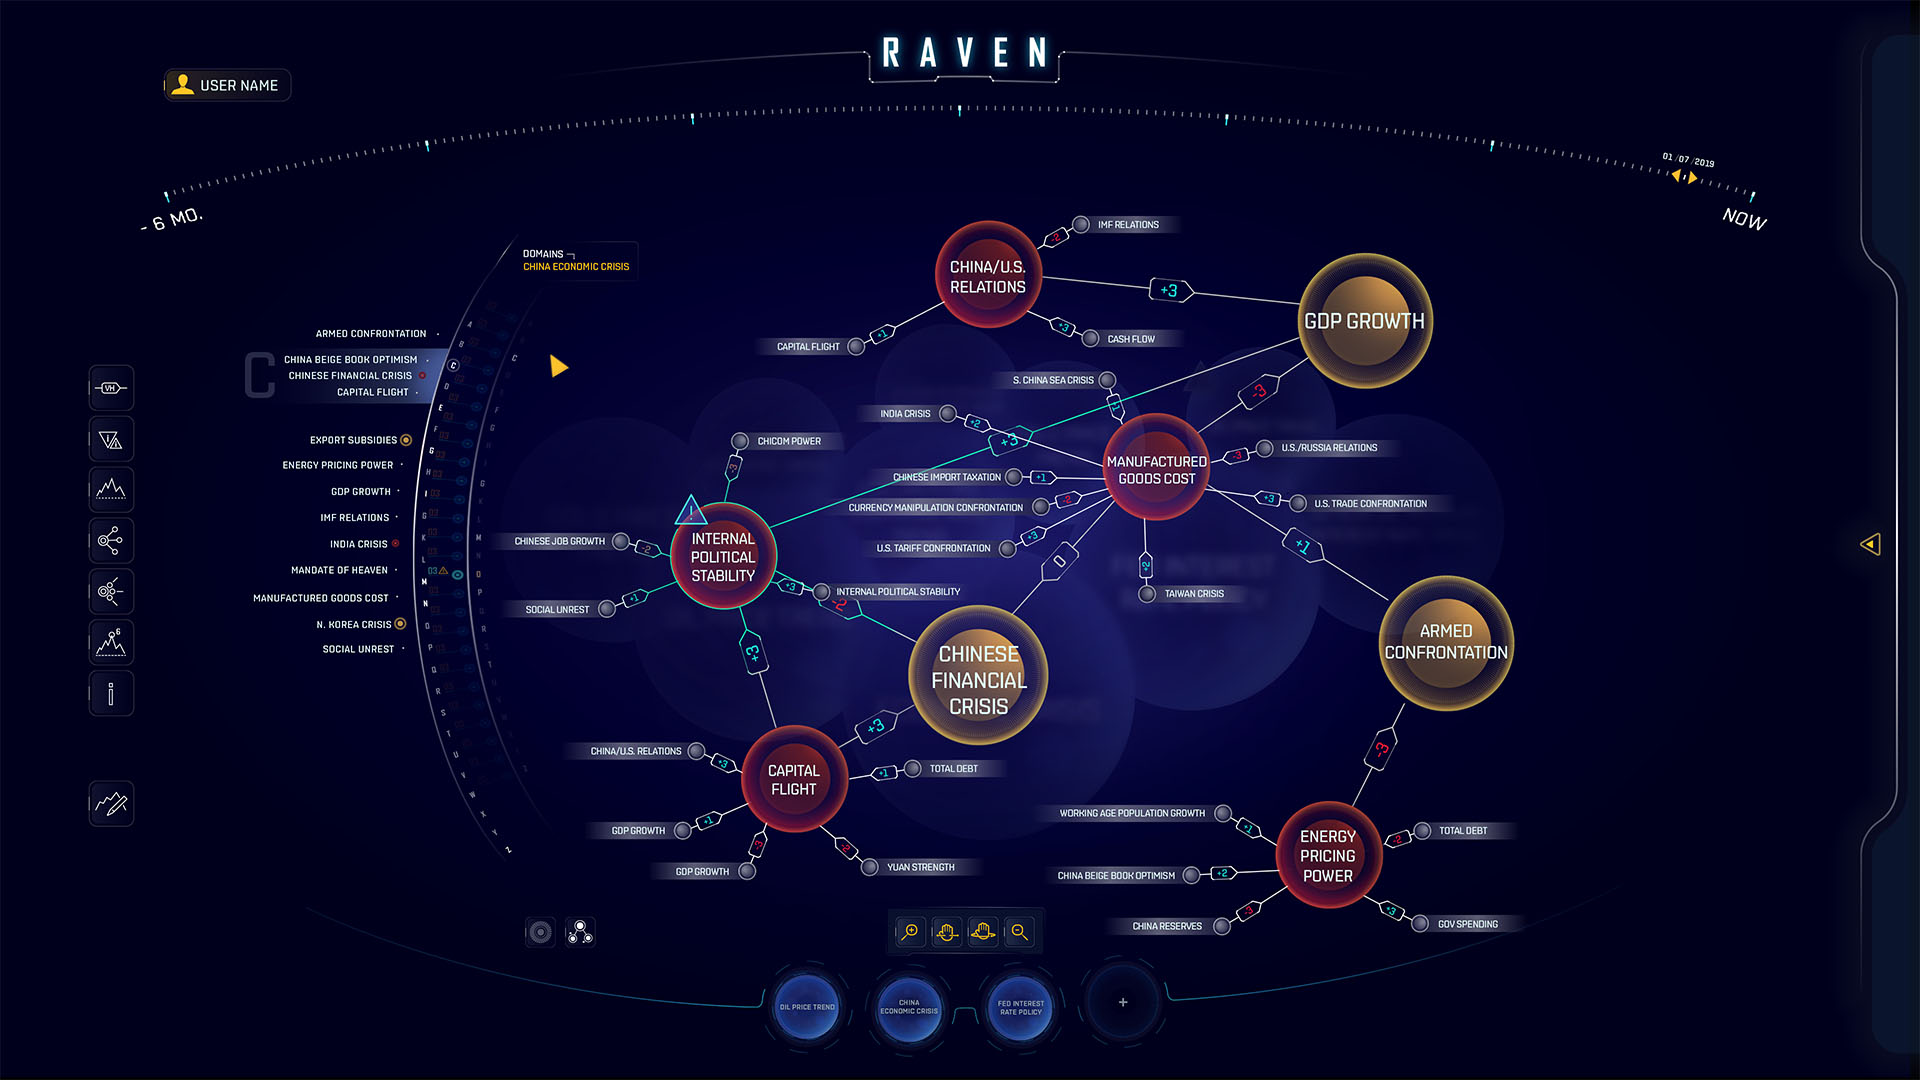
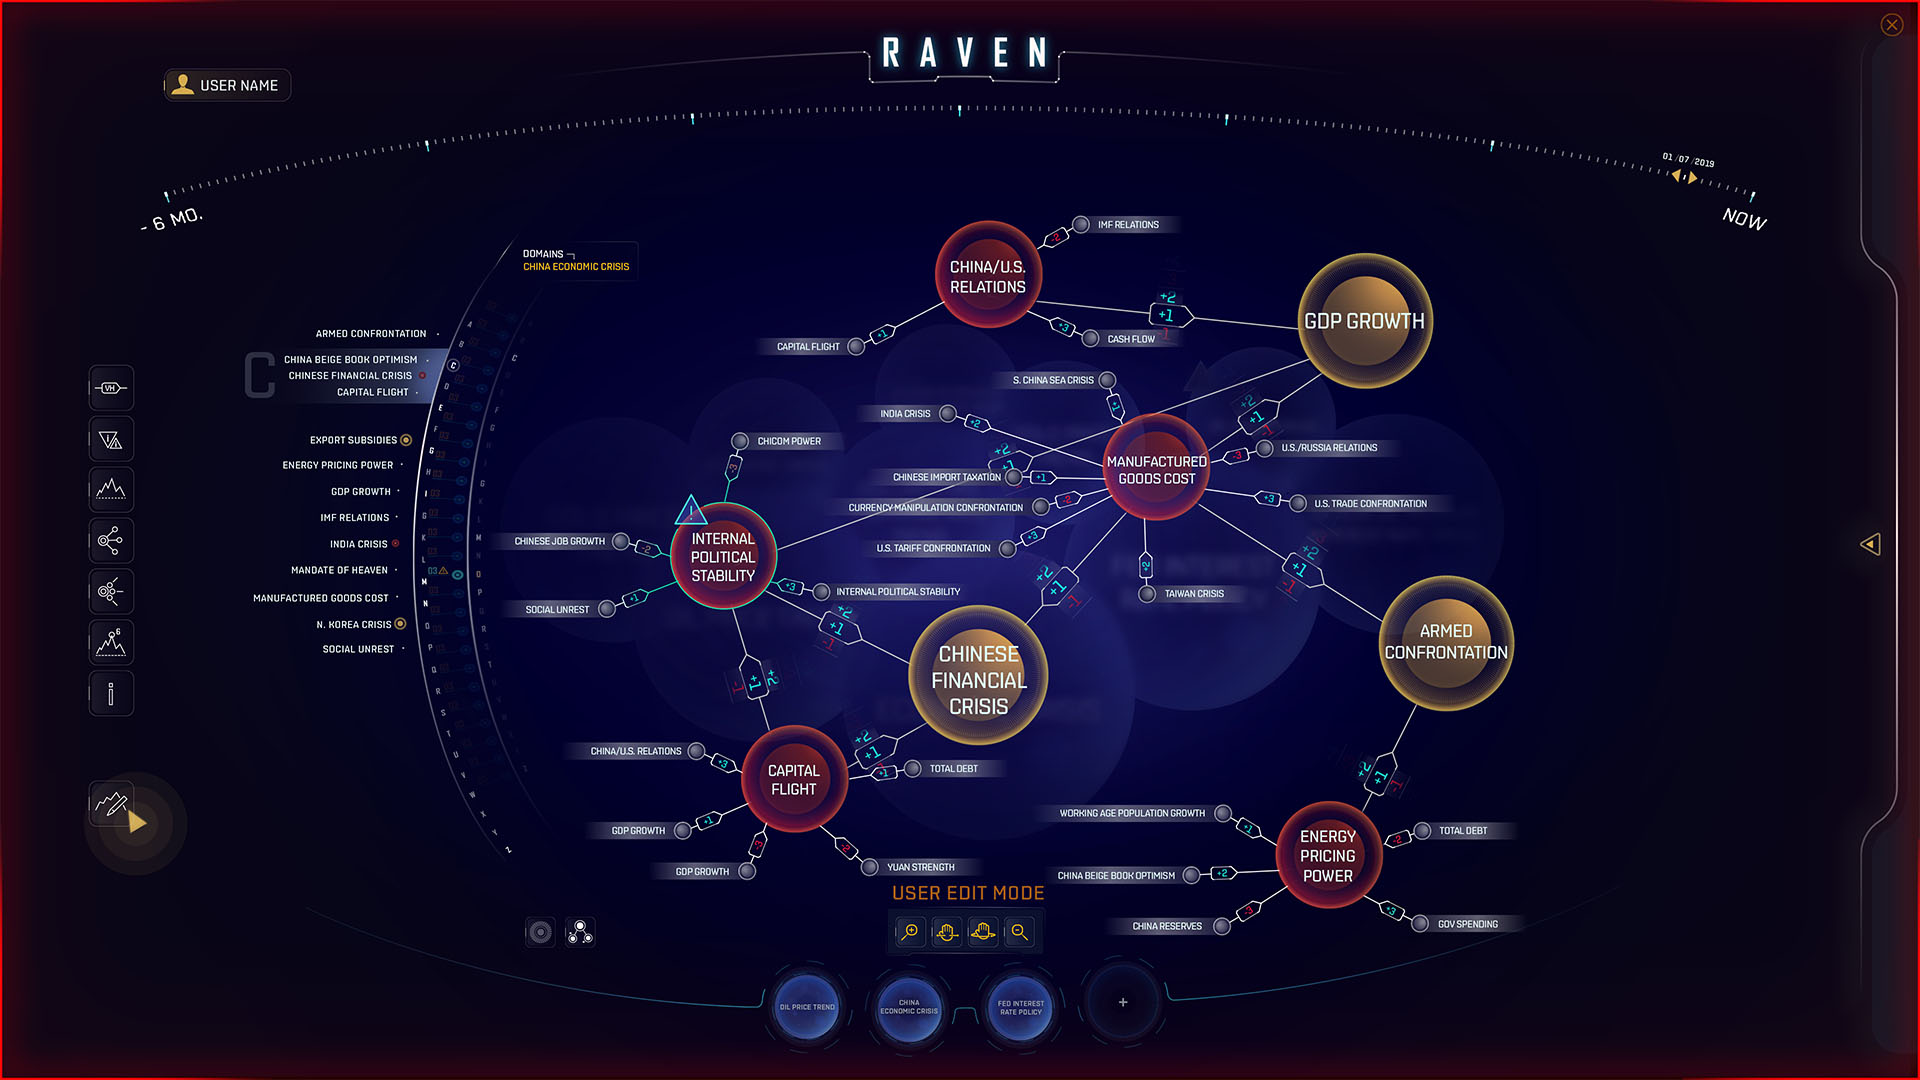
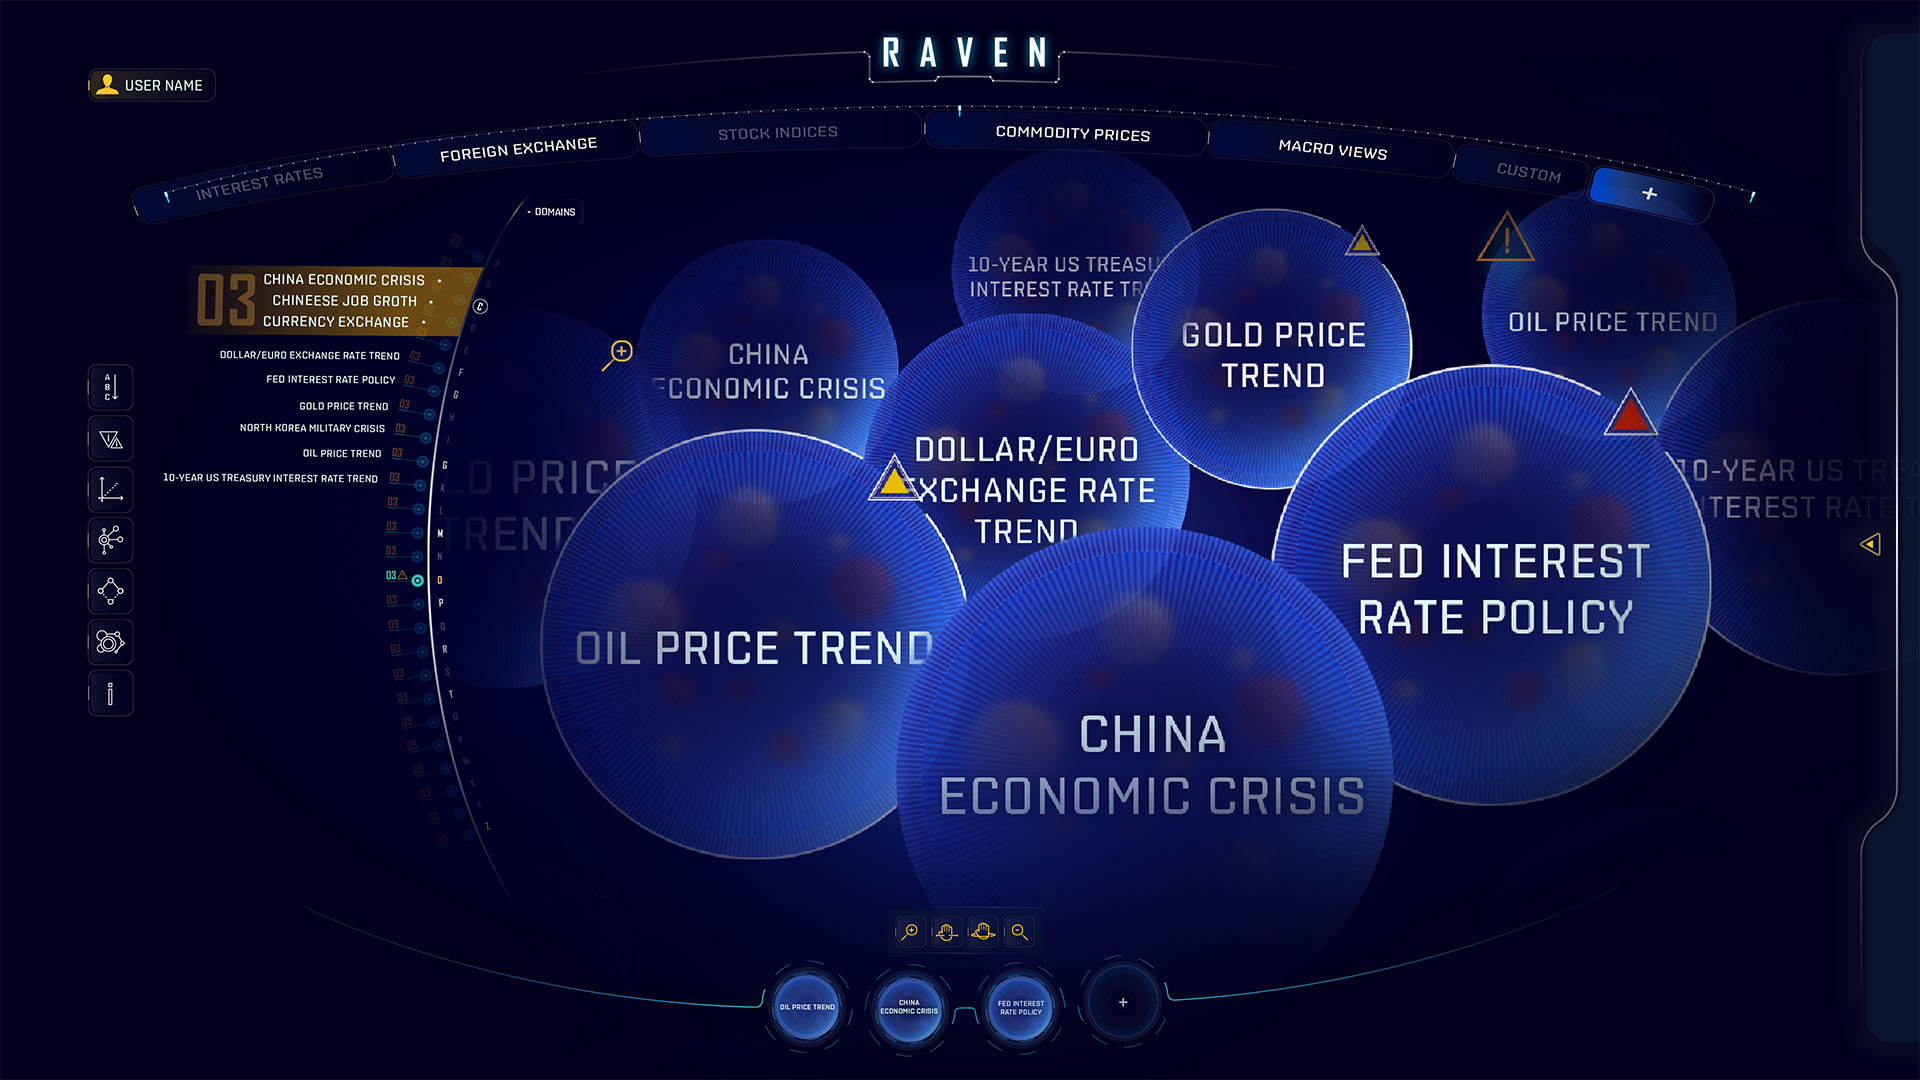
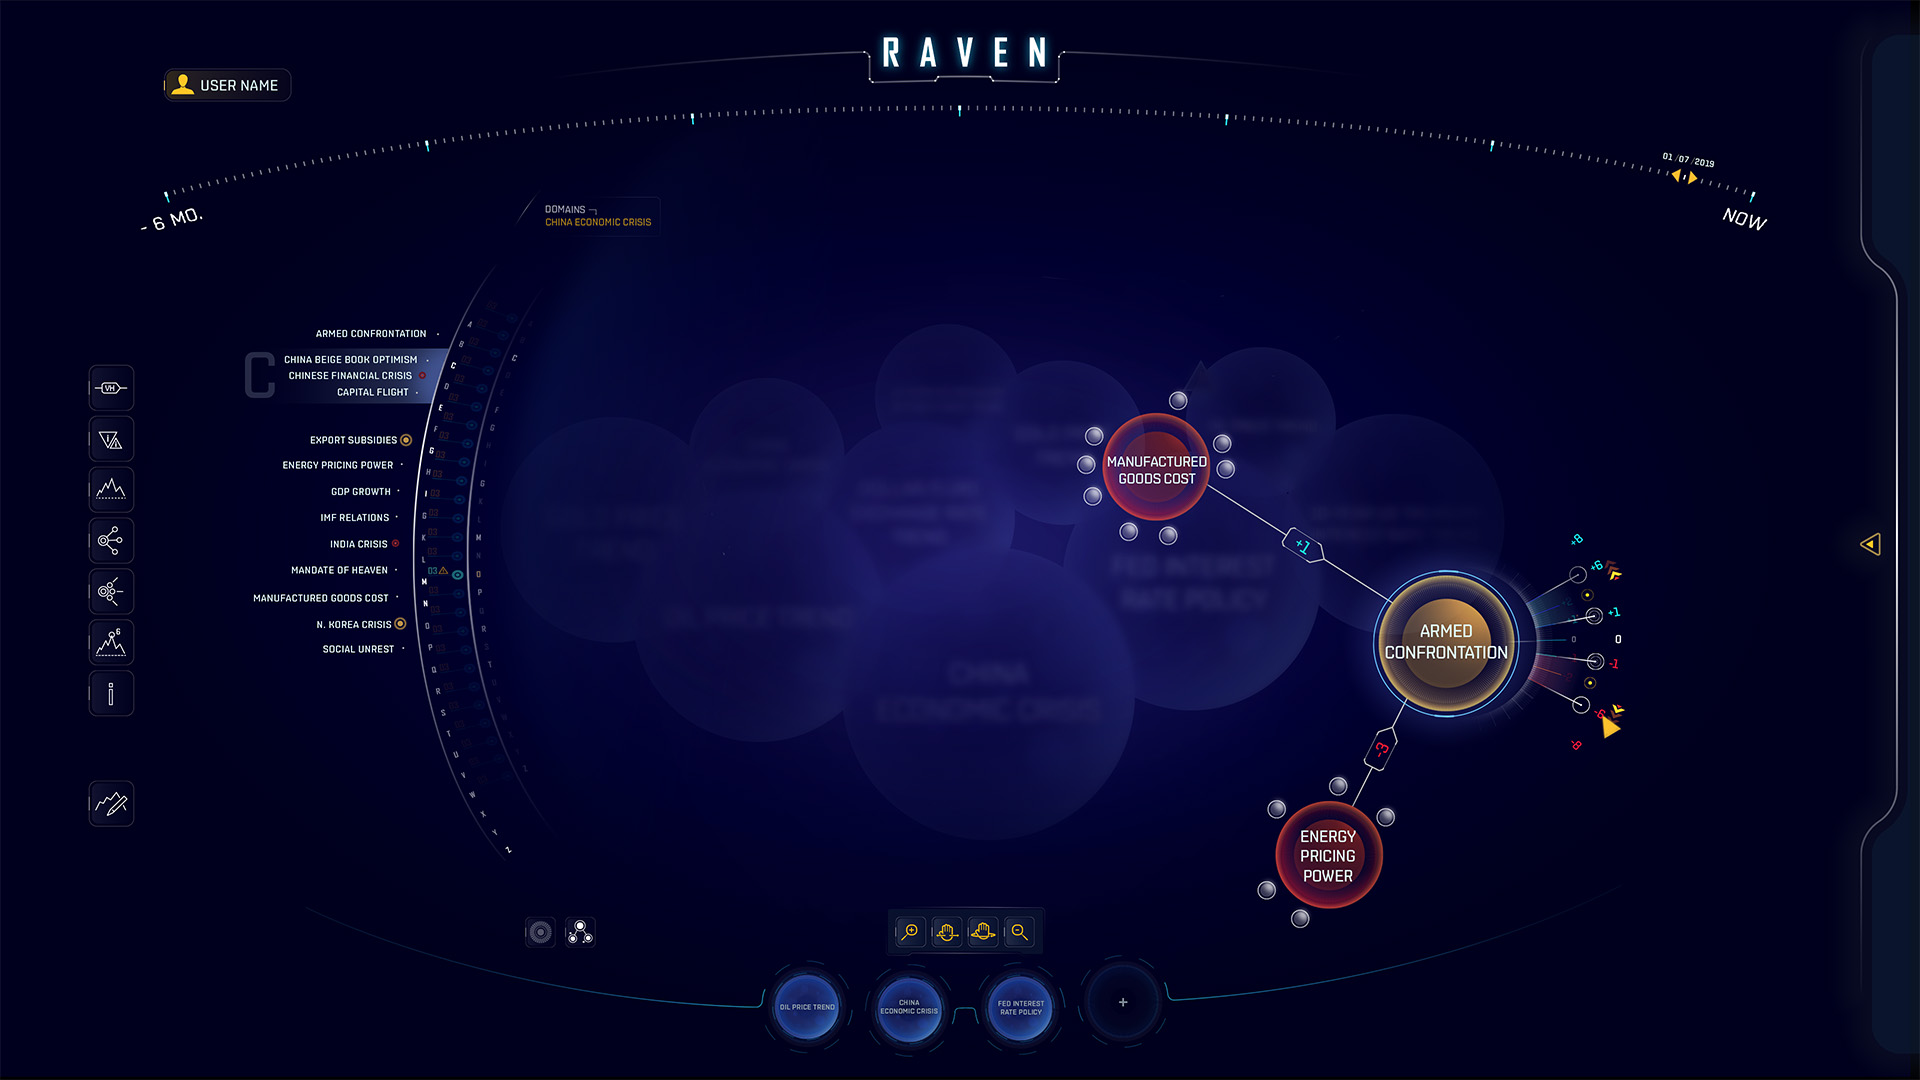
Using a node-based interface, key variables could be pin-able or savable so they could be easily accessed or persistently visible. We would use overlay visualization controllable by dynamic time sliders, check boxes or similar interactive elements to set the scope of the variable. The interface would also have the power of showing second-level or relevant connections when viewing a selected variable, and each variable would include details such as a graphic feedback, information from SMEs and relevant articles. Finally, Raven’s nodes would include a one-click export functionality that reflected the data and relevant summaries and sources for any variable.
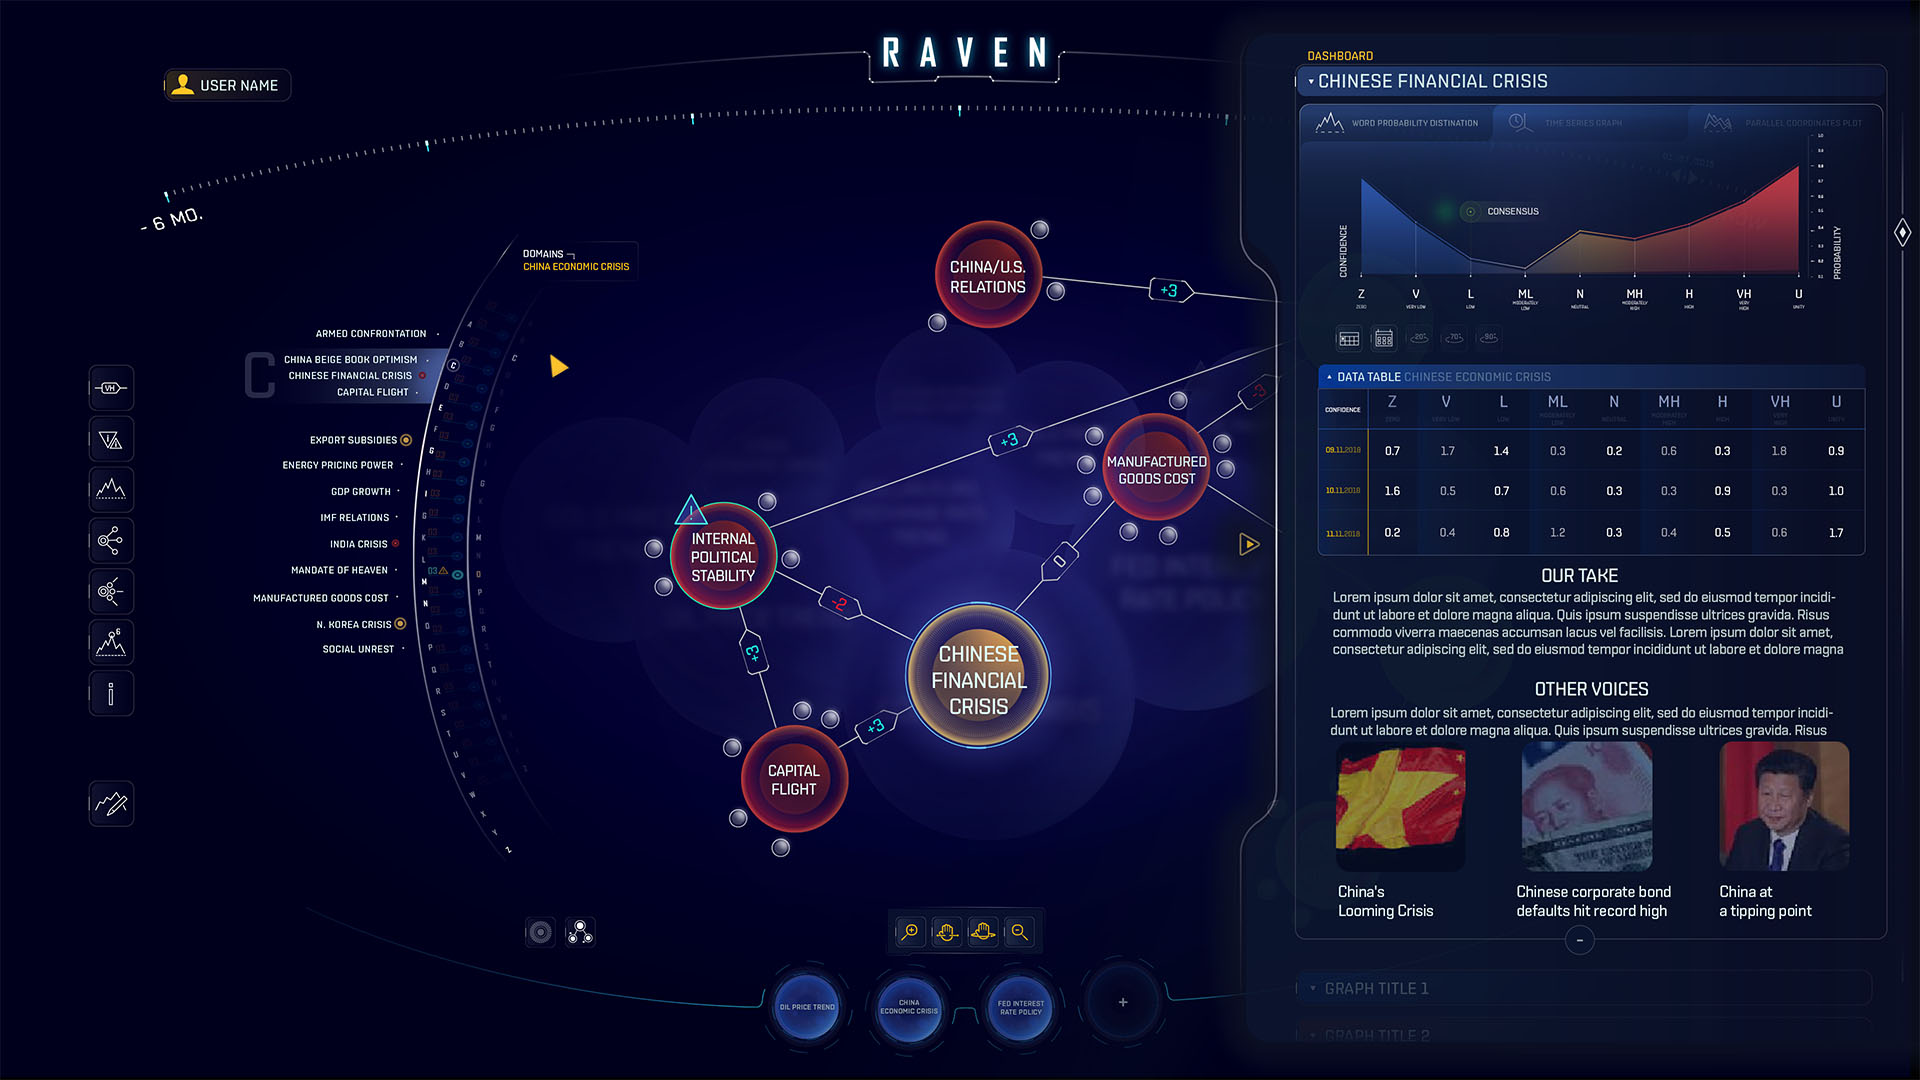
Node Tree Expanded View
07
FINAL DESIGN
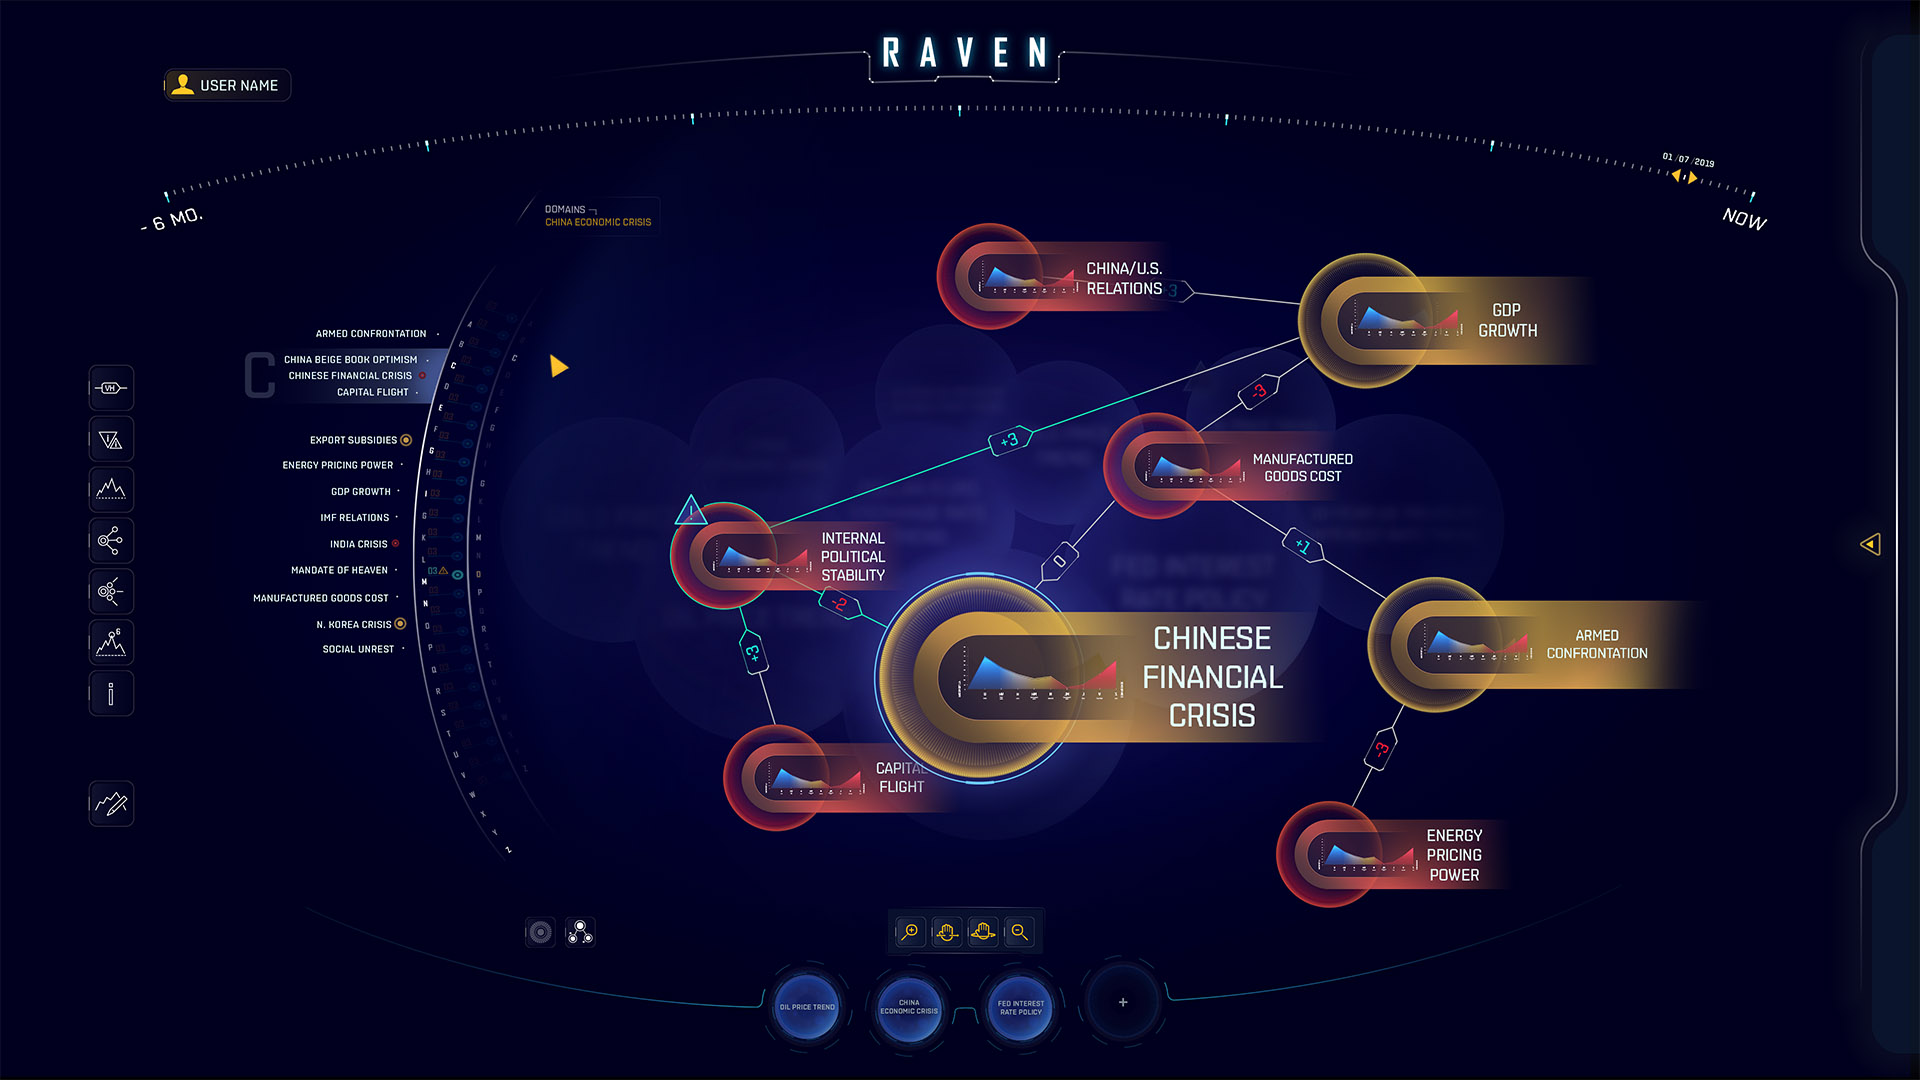
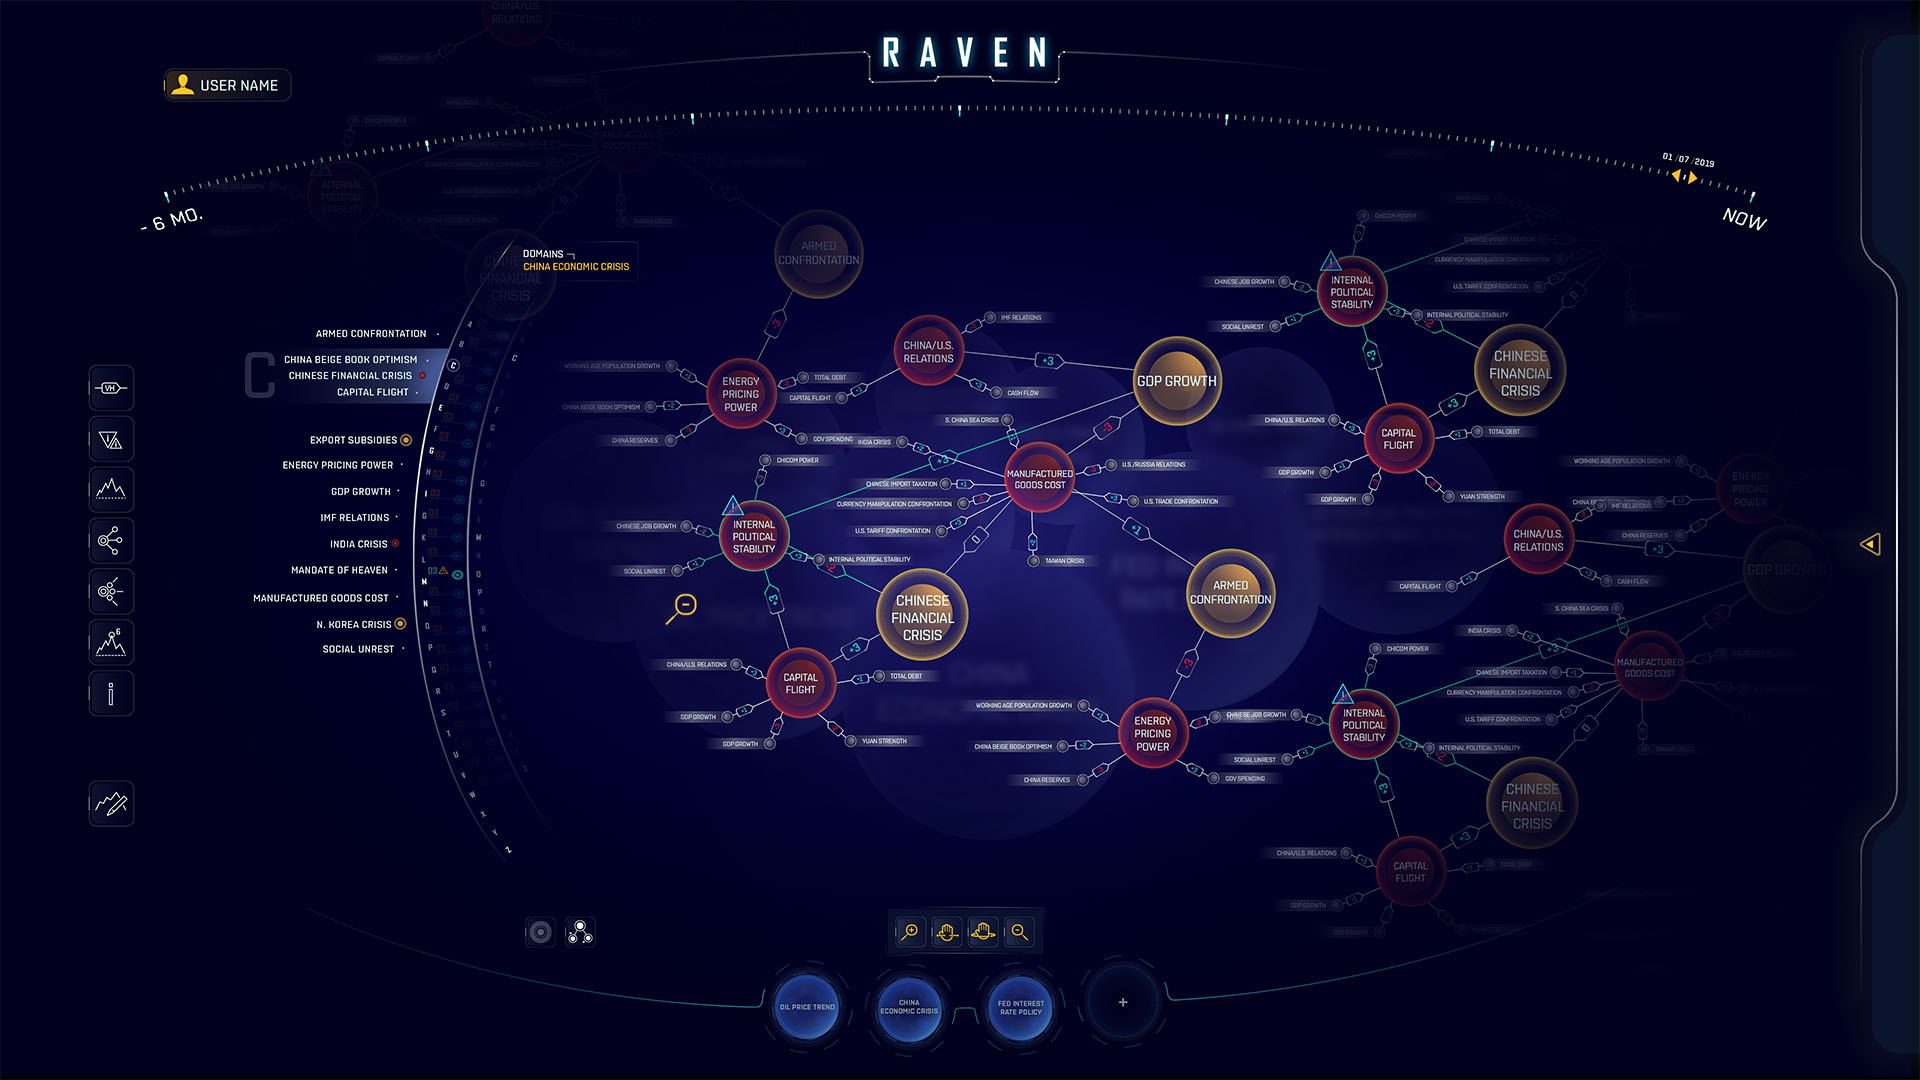
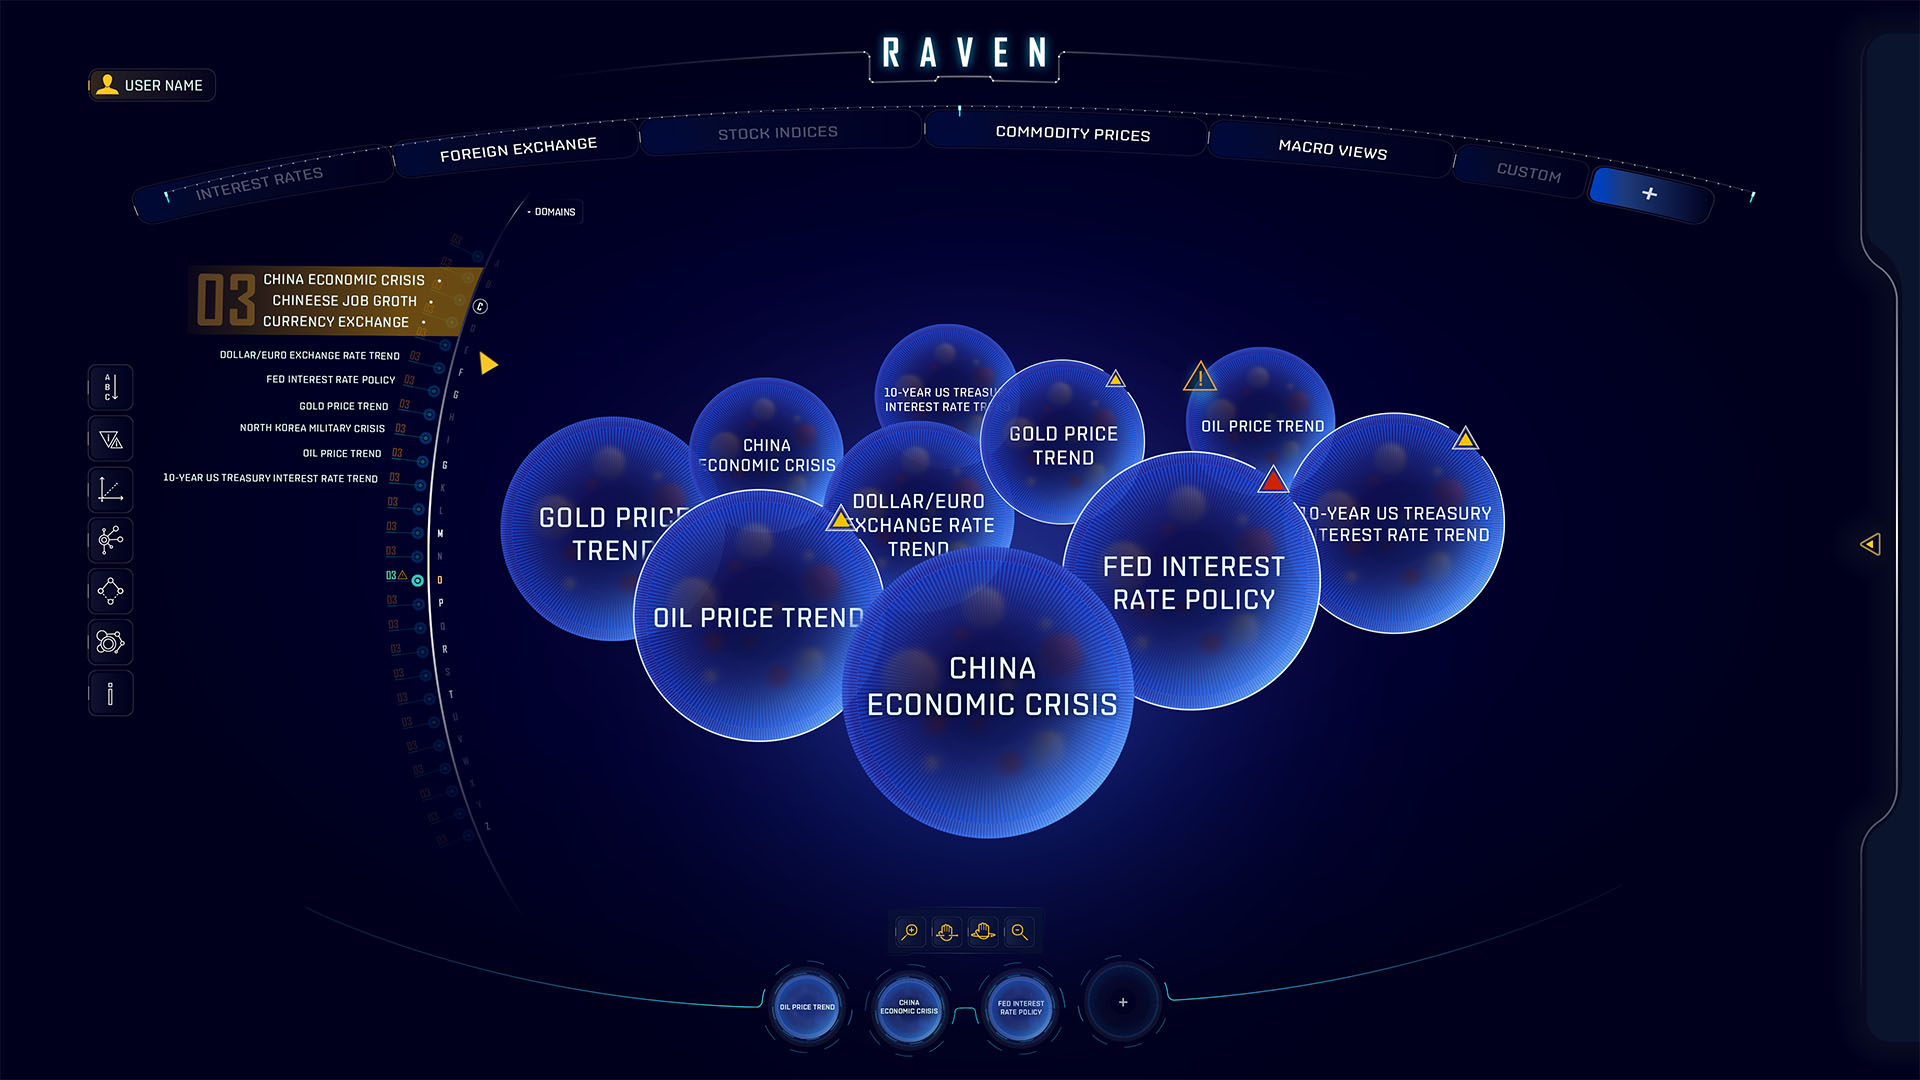
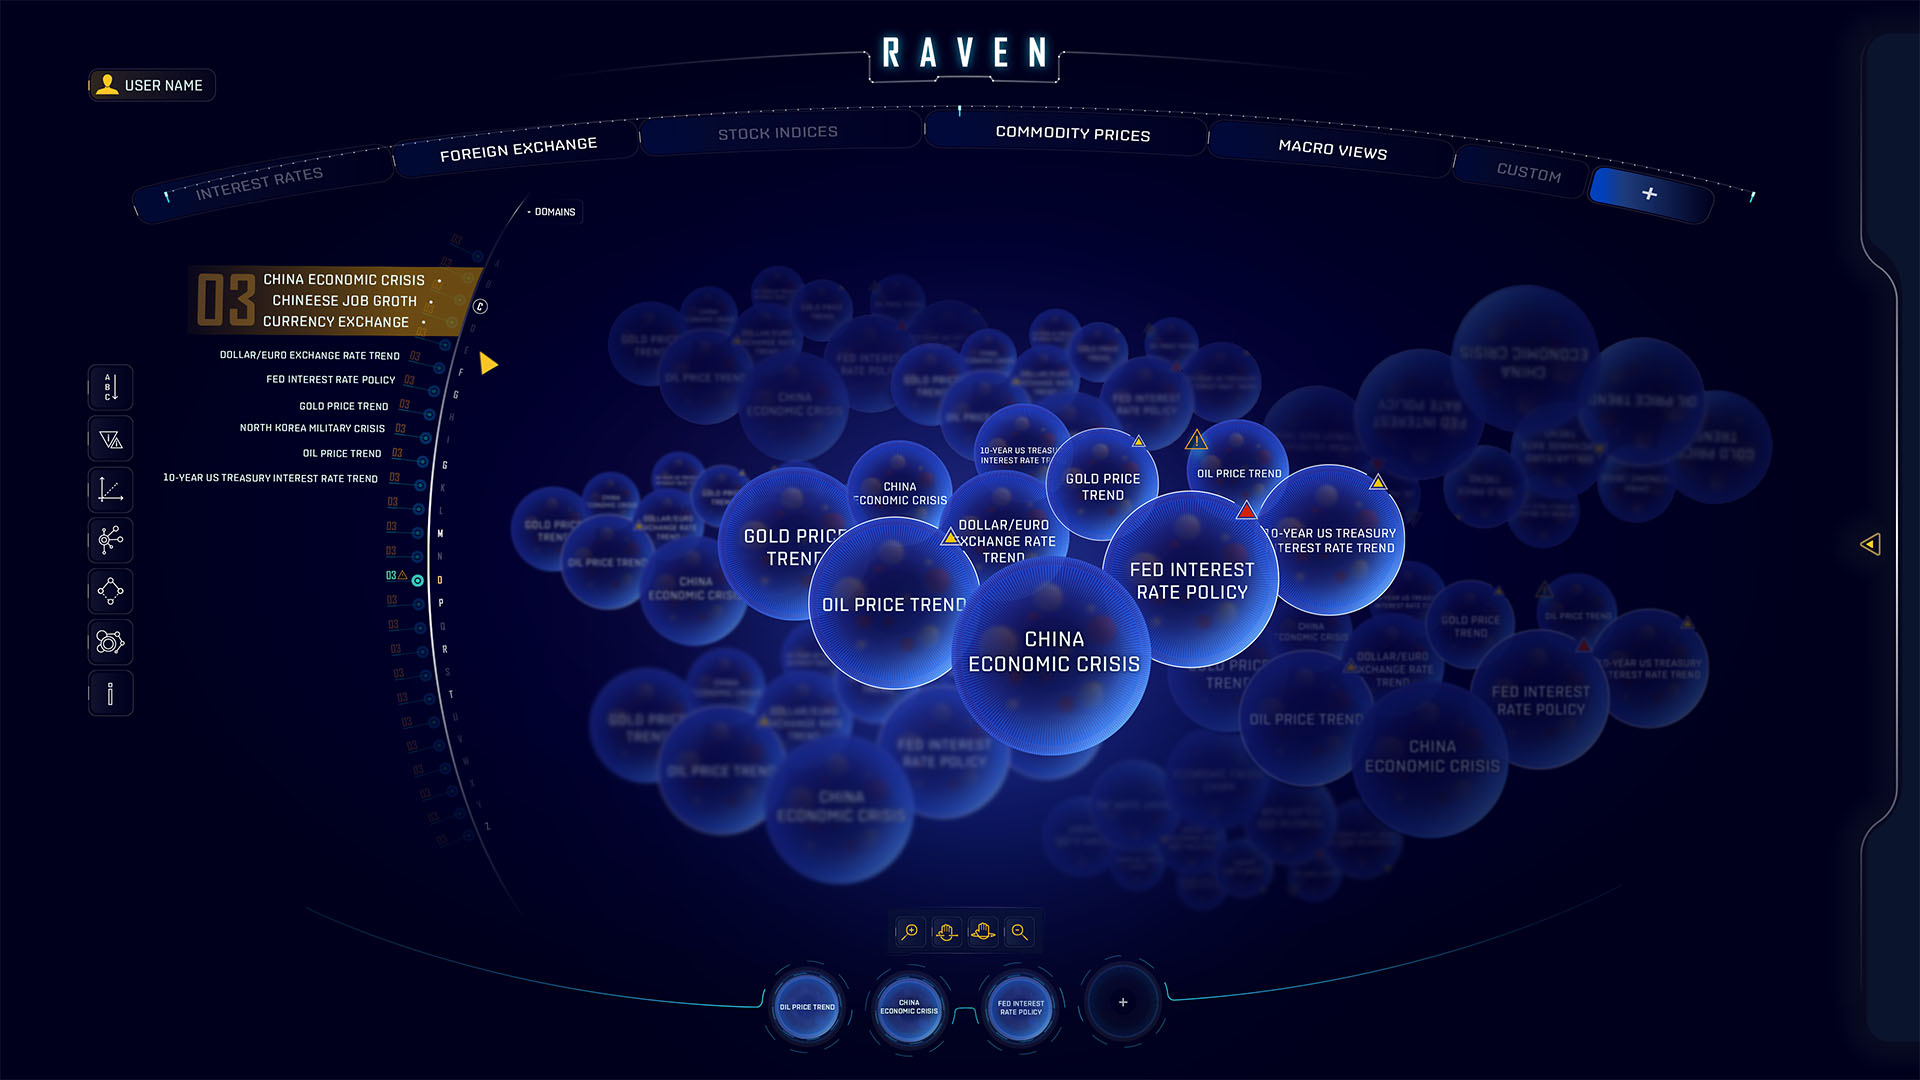
Our final design combines all integral key features with Meraglim’s initial considerations in a node tree interface. Using distinctive colors to represent vital information and placement, the interface showcases nodes representative of a value connected with other situational value nodes. This node tree places the highest priority nodes at the front of the web, with less important but still relevant nodes towards the back.
Final Design of Circular Node Priority View
08
CONCLUSION
Raven is a highly advanced financial tool that our team at Perception is proud to have helped bring to life. This powerful platform is the next step in financial technology, leveraging AI to access real time and predictive information. User experience is a crucial element of every interactive technology program and we are honored to have elevated it through an advanced yet easily navigational node tree interface.
Discover more about Meraglim.